From raw metrics to
AI root cause to your phone.
Real-time infrastructure monitoring, AI-powered incident analysis, and eight notification channels — all wired together automatically. One platform, complete observability.
Monitor. Detect. Alert. Analyze. Fix.
Not three separate tools patched together. One platform where metrics feed alert rules, alert rules trigger AI analysis, and AI analysis routes to every channel your team uses.
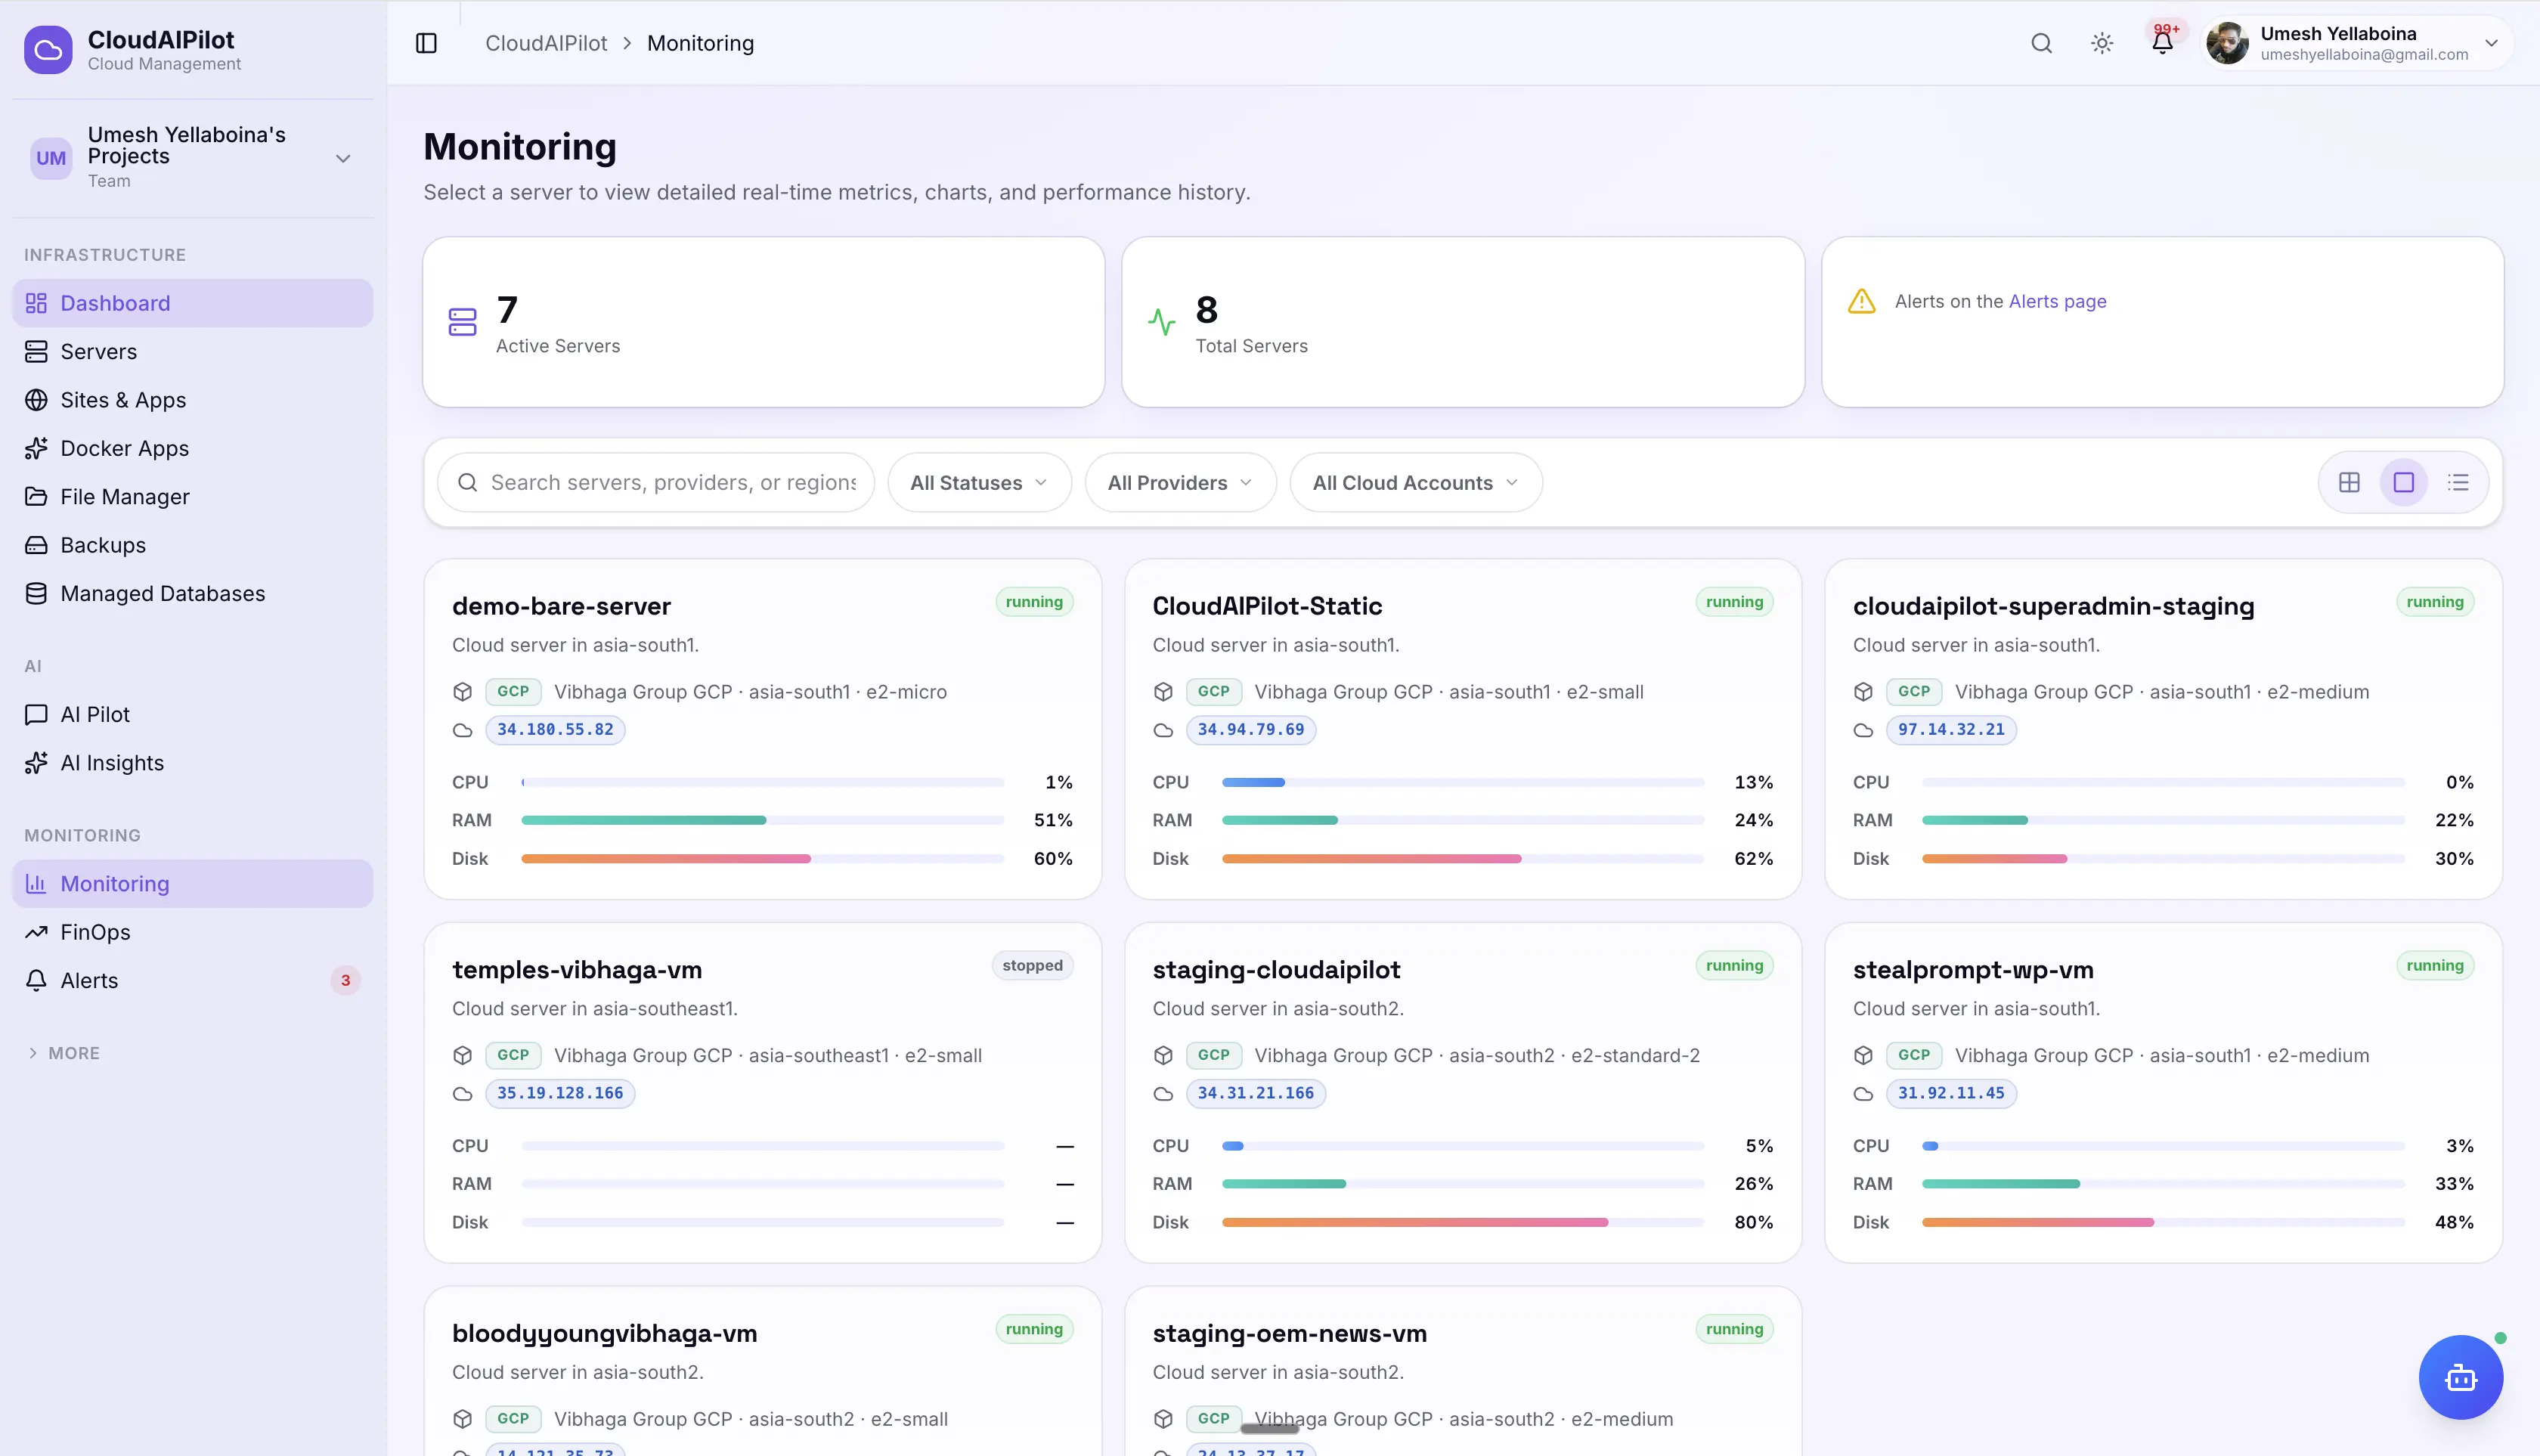
Real-time infrastructure monitoring
12 system metrics per server, refreshed every 60 seconds via agent push, SSH, or cloud API. WebSocket streaming keeps your dashboard live without polling. 30 days of history with intelligent downsampling.
AI-powered root cause analysis
When any warning or critical alert fires, the AI agent investigates automatically — gathering top processes, logs, disk breakdown, and current metrics over SSH, then delivering a root cause + fix recommendation within seconds.
Multi-channel alerting with escalation
8 notification channels including SMS and WhatsApp. Flexible alert rules with hysteresis, maintenance windows, and 3-step auto-escalation for critical events. 35 event types routed through one unified dispatcher.
Every server. Every metric.
Always current.
Metrics stream from every server in your fleet — via an agent if installed, SSH fallback if not, or directly from cloud provider APIs. No gaps, no dead zones. Data is always less than 60 seconds stale.
3 collection methods, one result
Agent push (primary) → SSH on-demand if data >2 min stale → Cloud API fallback (AWS CloudWatch, GCP Stackdriver, Azure Monitor, DO). Any server, any access level.
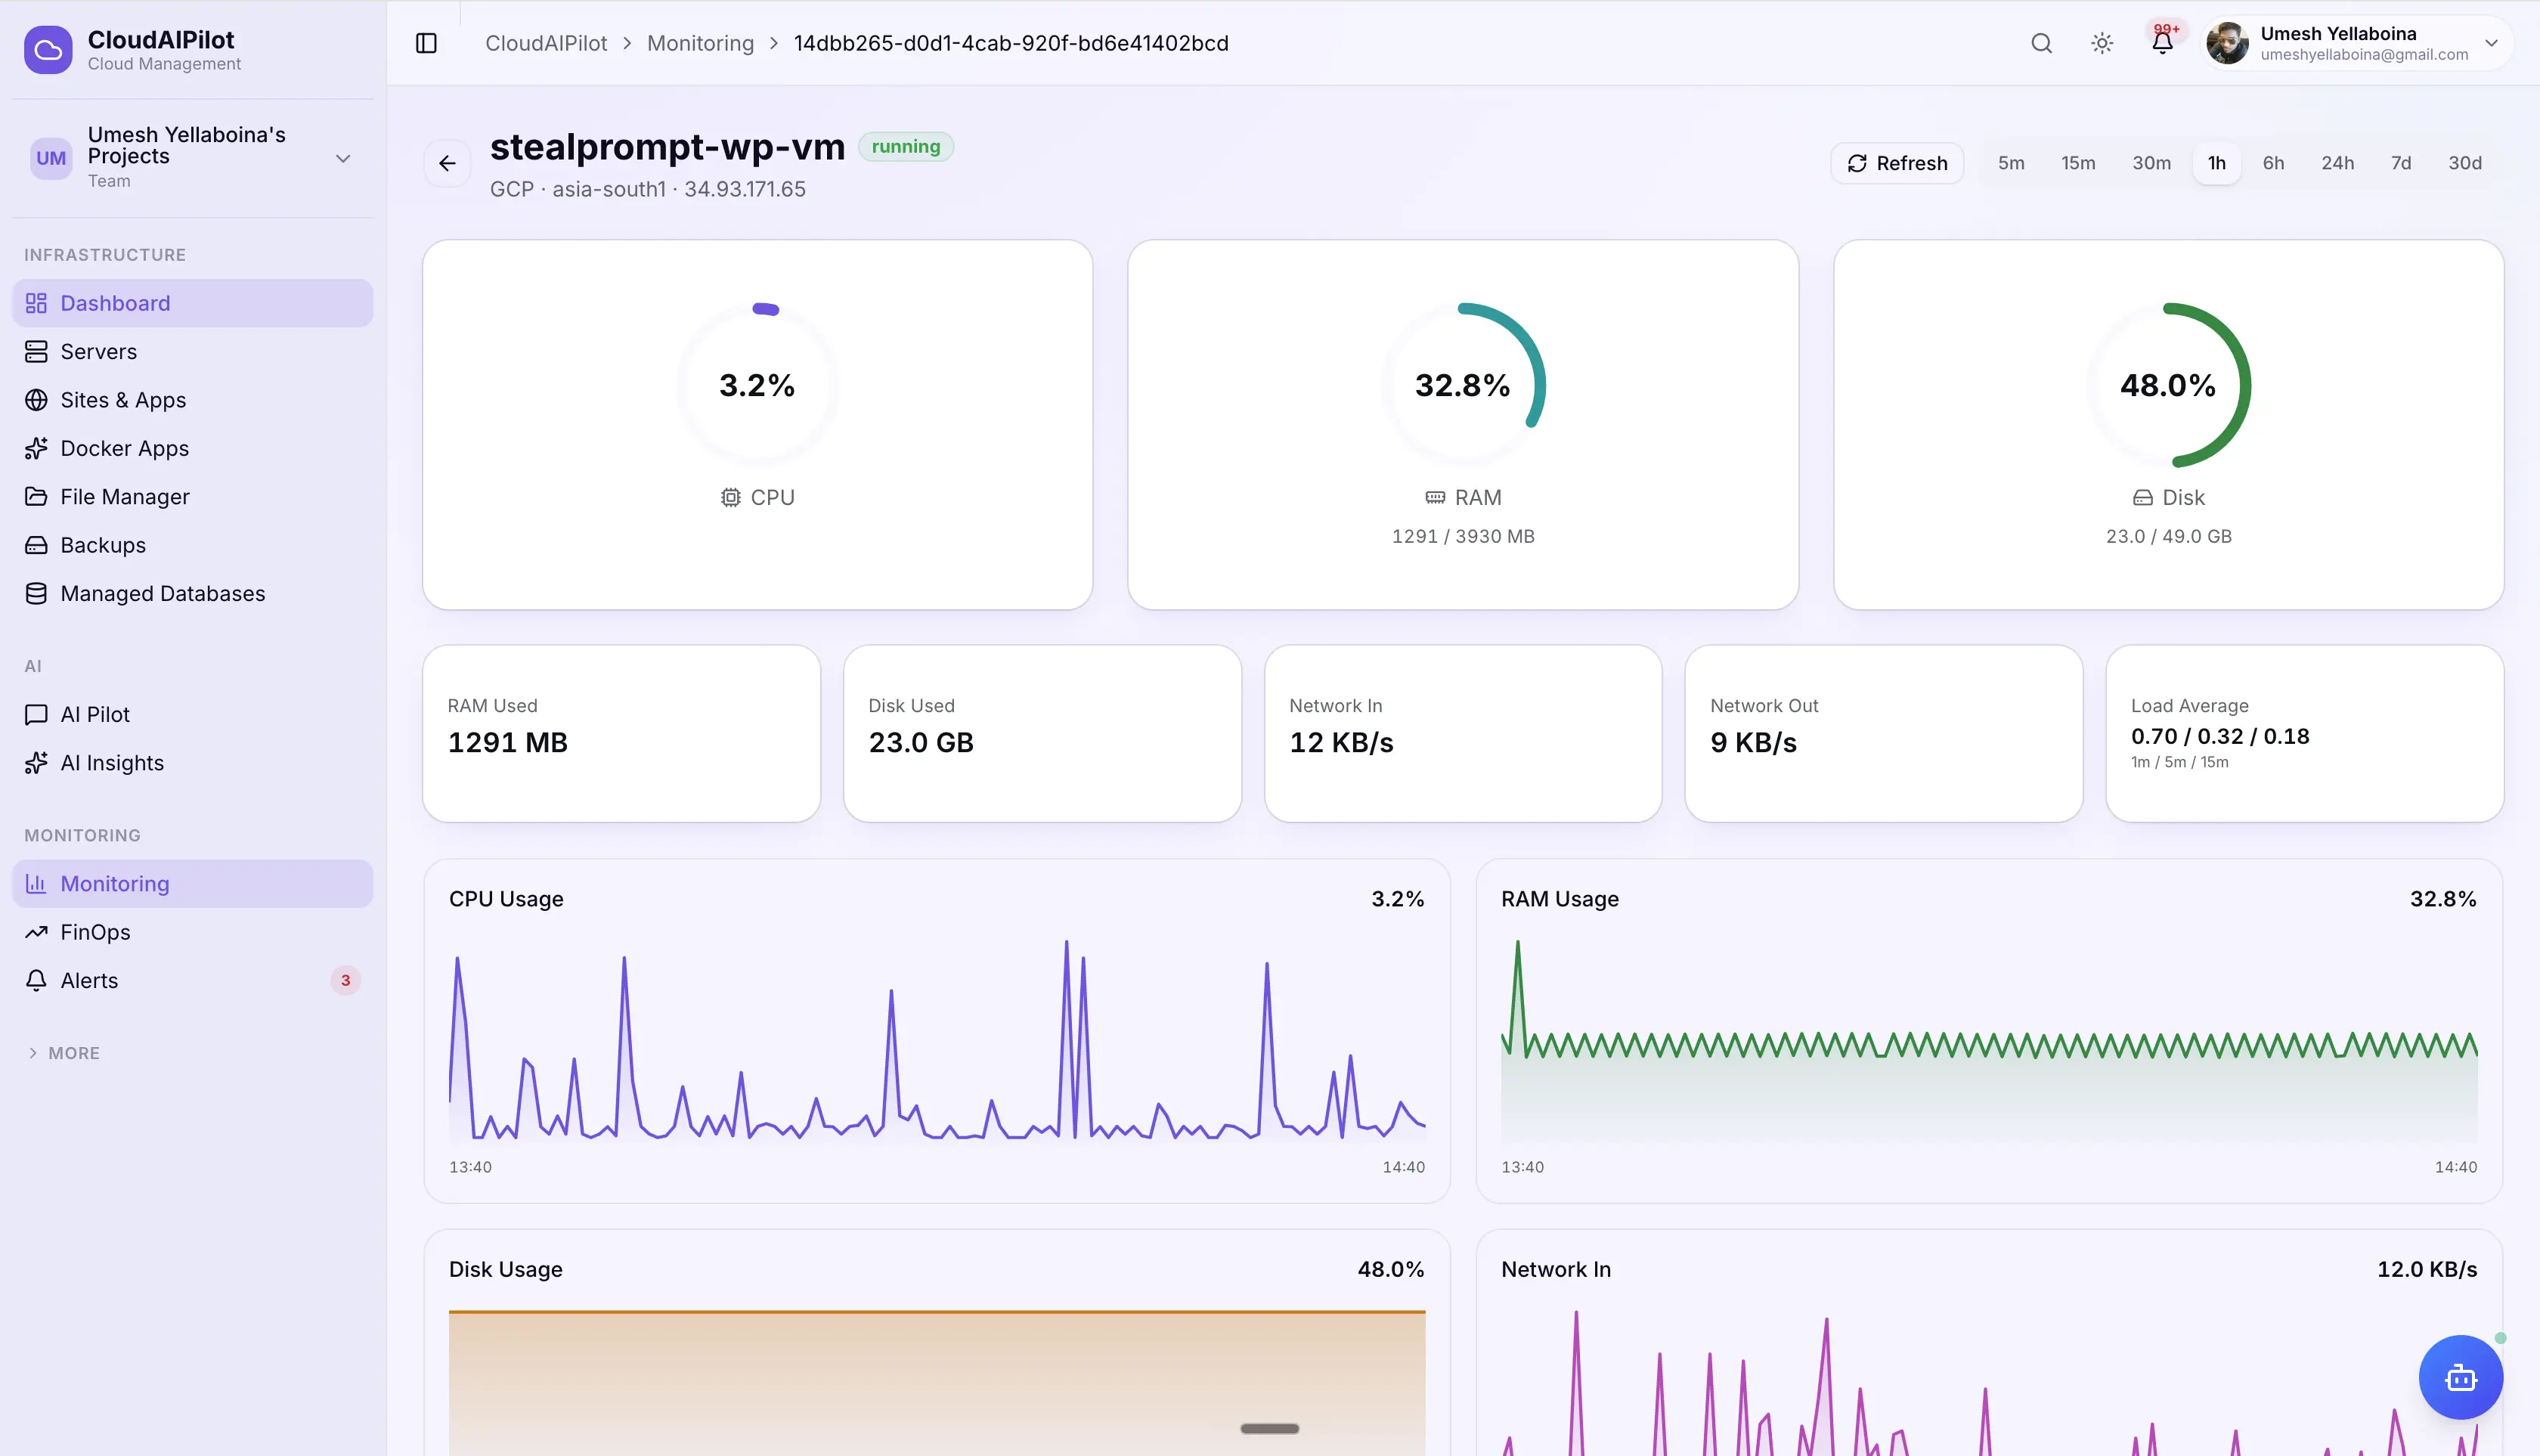
30-day history, intelligently downsampled
Query any time range from 5 minutes to 30 days. Large datasets auto-downsample to ≤300 points for fast chart rendering. Line charts update in real time via WebSocket.
Tile, Block, and List views
Switch between compact tile gauges, detailed block cards, and dense list view. Filter by status (running / stopped) and search by server name or hostname.
Alert fires. AI investigates.
You get the answer.
Five seconds after a warning or critical alert fires, the AI agent SSHes into the server, gathers live evidence, and delivers a root cause analysis with a recommended fix. No manual triage. No context-switching.
Live evidence gathering via SSH
Top 5 processes by CPU, uptime & load averages, disk breakdown (du/df), recent syslog errors, and all 12 current metric values — collected in one SSH round-trip before the AI sees a single byte.
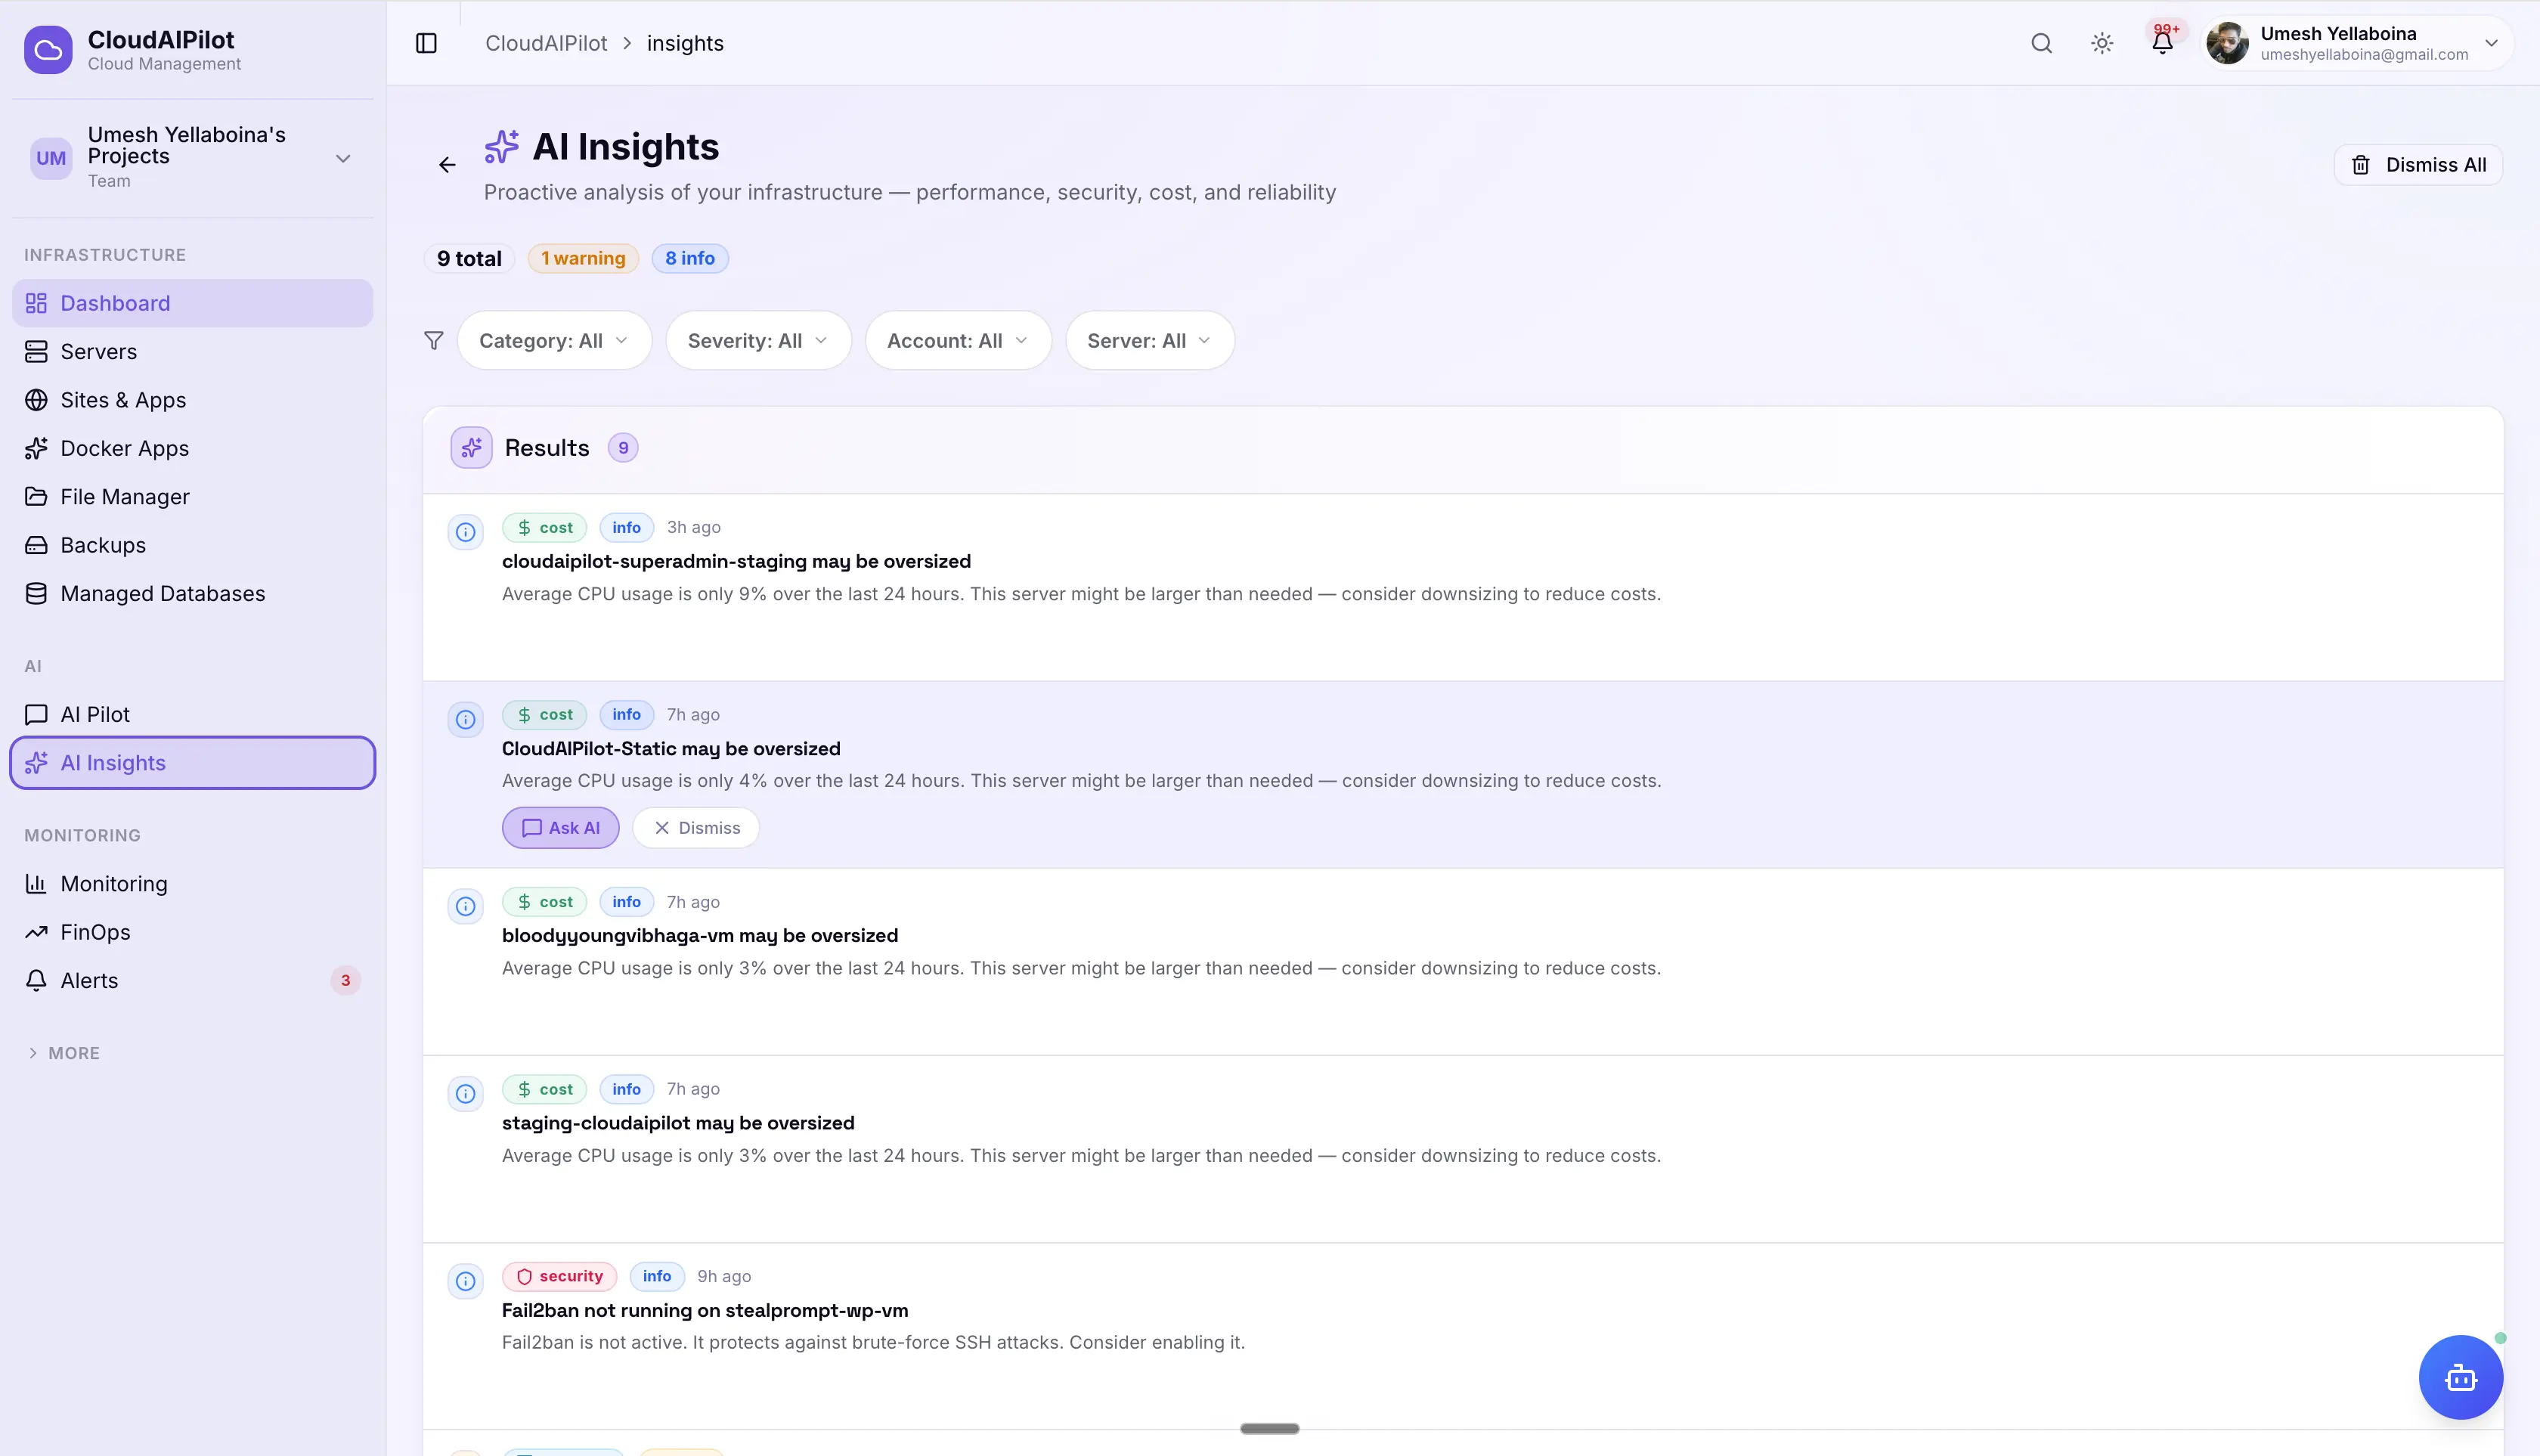
4 insight categories
Performance (CPU spikes, slow queries), Security (suspicious processes, anomalies), Cost (over-provisioning, budget overruns), Reliability (downtime risk, backup failures). Filtered, dismissed, or actioned from one view.
"Ask AI to fix" — one click
Each insight can carry an actionToolName — a specific AI agent tool pre-loaded with the incident context. One click triggers the fix. The agent executes. The insight resolves.
Throttled, filtered, and auto-expiring
Max 1 analysis per server per 15 minutes — no insight storms. Optional expiresAt auto-clears stale insights. Dismiss individually or batch-clear the board.
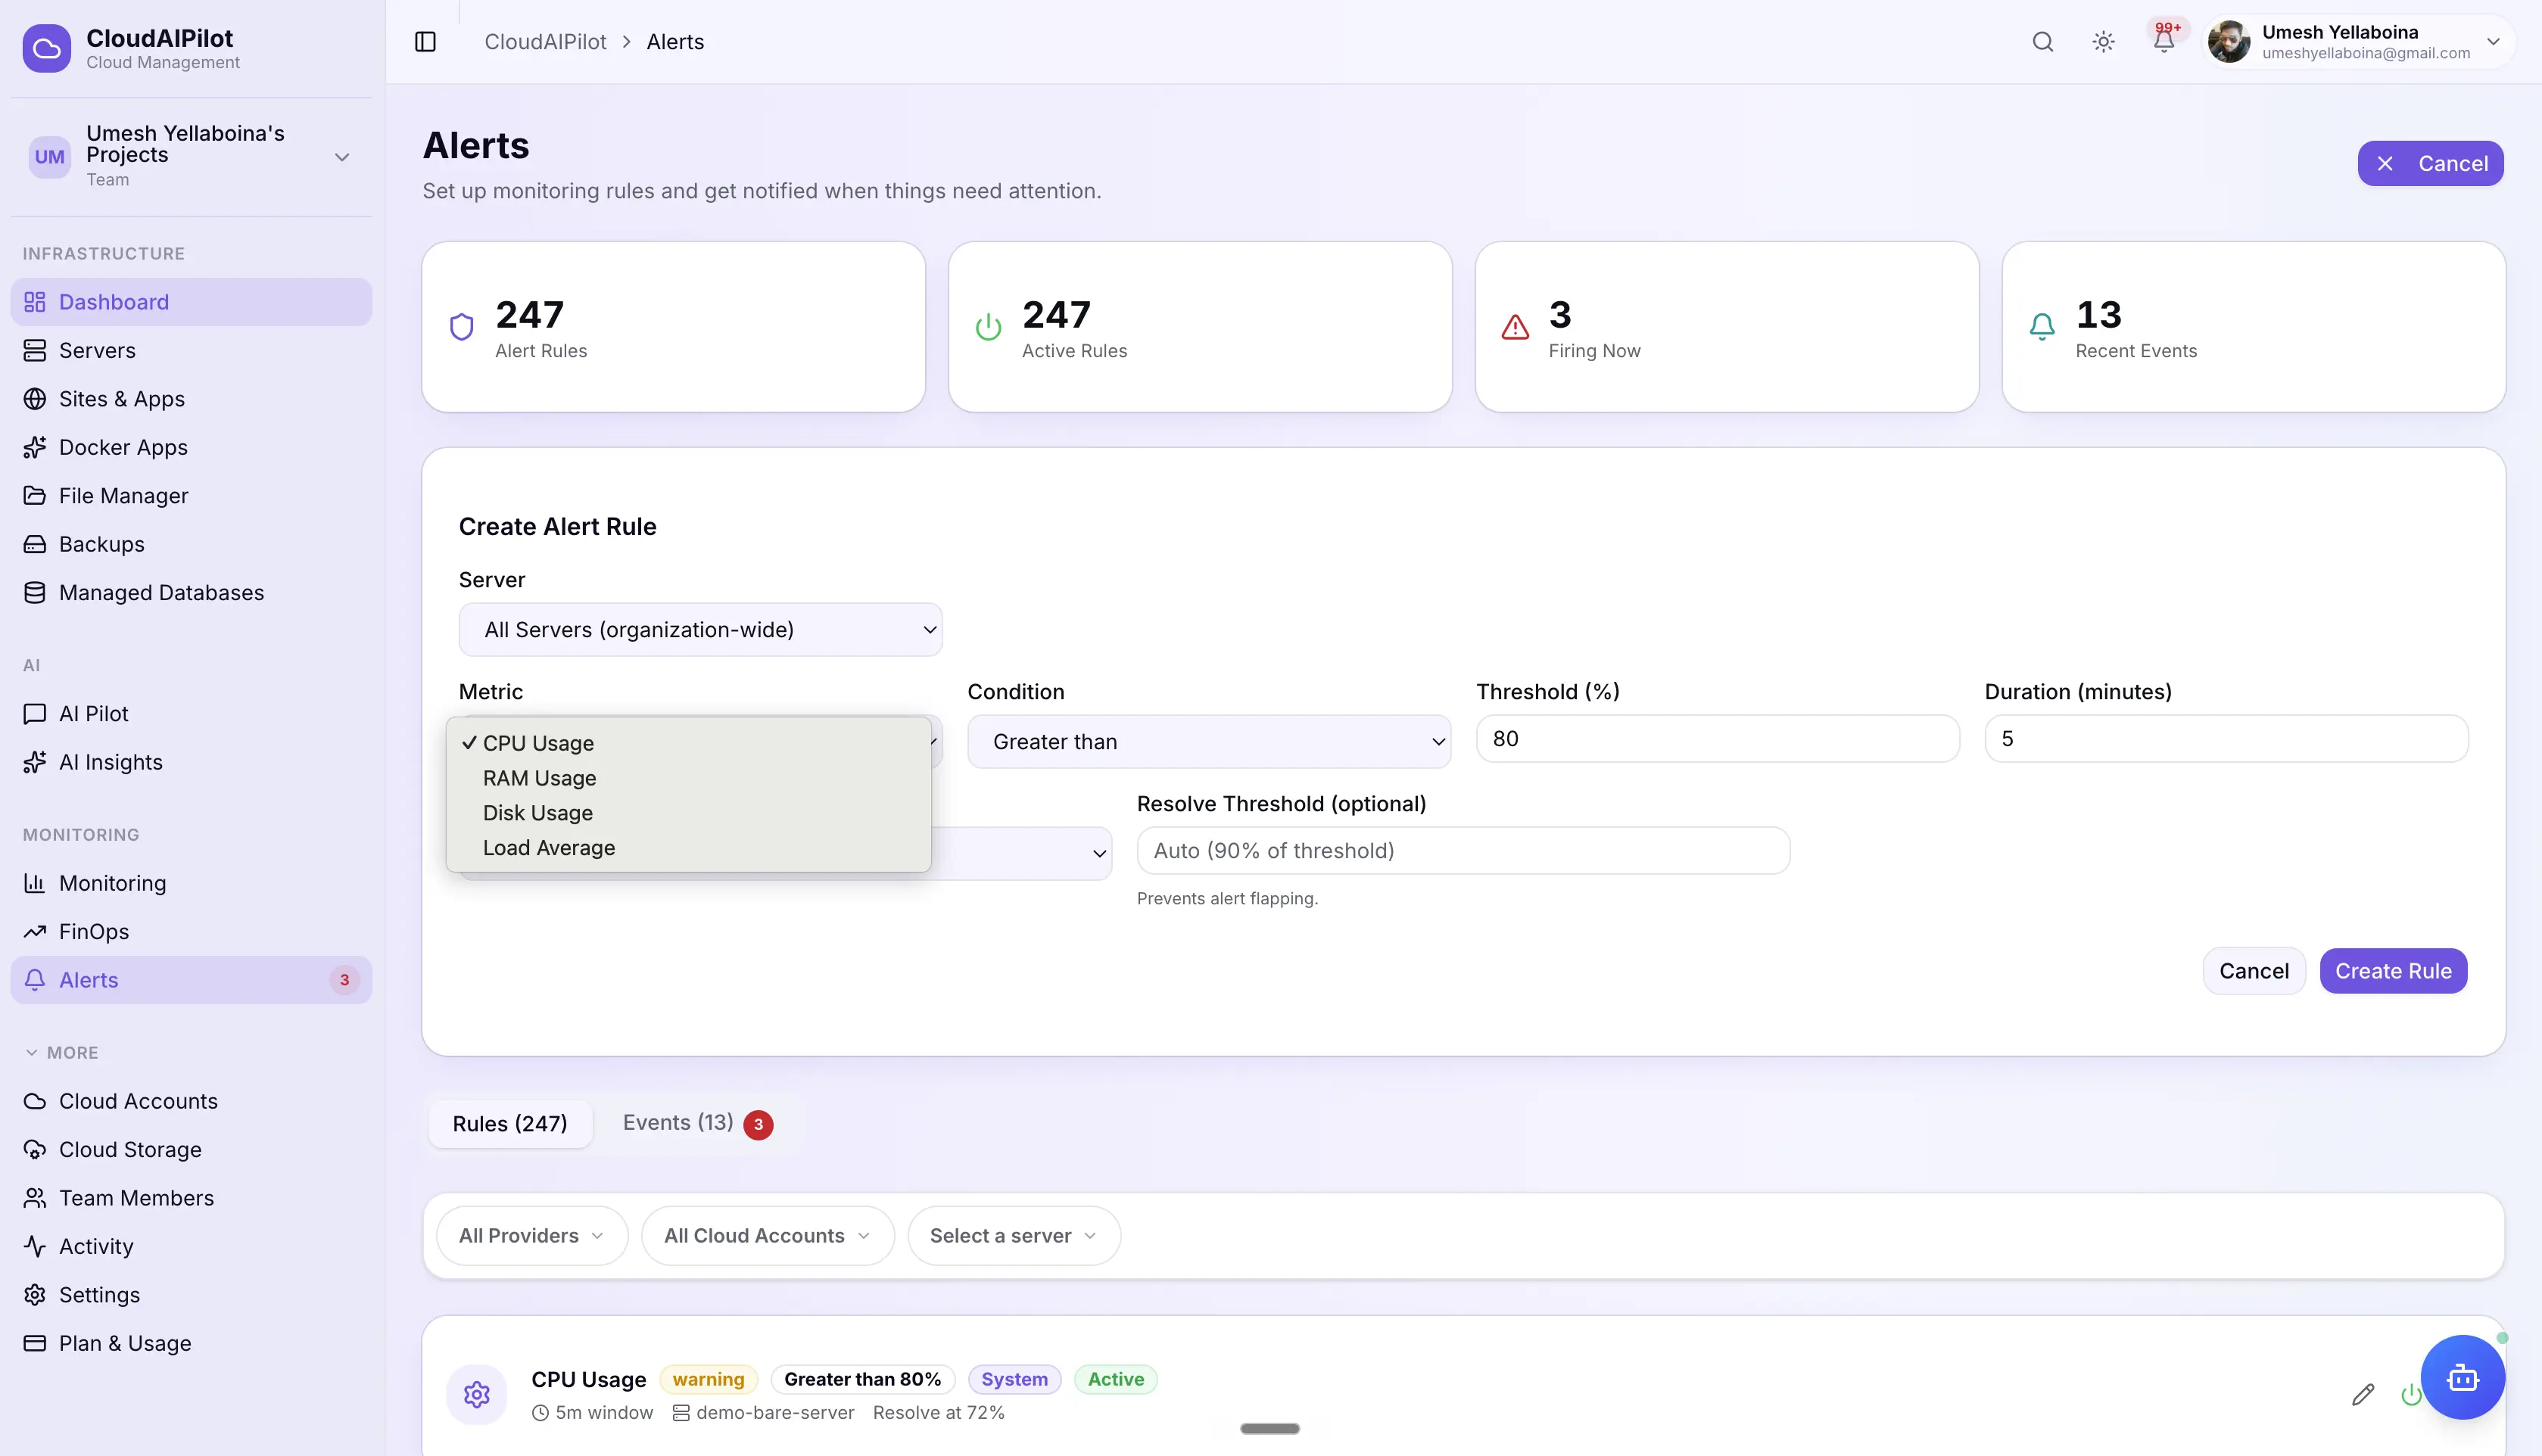
Your thresholds.
Your evaluation window.
Rules evaluate against an average over a time window — not instantaneous spikes. Set CPU > 80% for 5 minutes and only sustained load triggers an alert. Hysteresis prevents flapping when metrics hover near the threshold.
Hysteresis — no alert flapping
Set a resolveThreshold lower than the trigger. Alert fires at CPU > 80%, resolves when CPU drops below 70%. Metrics that hover near the threshold don't spam your channels.
Maintenance windows
Set a maintenance window on any server for N minutes. Alert events are still logged, but notifications are suppressed — no alert noise during planned restarts or migrations.
Snooze, acknowledge, or resolve
Snooze any active alert for 15 min to 24 hours — it reverts automatically when the snooze expires. Acknowledge to stop escalation. Manually resolve when the issue is fixed.
8 channels. Including your phone.
Route alerts to wherever your team actually looks — from Slack and Discord to Telegram, WhatsApp, and SMS. Configure once, test with a single click, and every future event routes automatically.
X-CloudAIPilot-Signature header for verification.SMS and WhatsApp carry a per-message delivery charge from the messaging provider. All other channels are free to configure and use.
Critical alerts escalate. Everything else digests.
Critical, unacknowledged alerts automatically escalate through three steps. Non-critical events batch into digests to keep your channels clean. Critical always bypasses digest and sends immediately — no exceptions.
3-step auto-escalation
Set an escalationMinutes on any critical rule. If the alert isn't acknowledged, resolved, or snoozed within that window, CloudAIPilot escalates — three times.
First escalation — at N minutes
⚠ "UNACKNOWLEDGED" notification sent to all configured channels. Bypasses 5-minute dedup cooldown.
Second escalation — at 2× N minutes
⚠ "UNACKNOWLEDGED" repeated to all channels. Includes elapsed time since alert first fired.
Final escalation — at 3× N minutes
🚨 "URGENT" final notification. No further escalation. Resolve, acknowledge, or snooze to stop further noise.
5 digest modes per channel
Each notification channel can be set to a digest mode independently. Batch low-priority events into summaries while keeping your critical path instant.
Configure once. Everything routes through it.
Every meaningful event in CloudAIPilot — from alert fires to backup completions, SSL expirations, failed logins, FinOps anomalies, and AI insights — routes through the same notification dispatcher and the same channels you already configured.
You know every notification that was sent.
Full delivery audit trail, per-member opt-out, and one-click channel testing — so you can trust that your alerts are actually reaching the right people.
Full delivery audit trail
Every notification logged per channel — sent or failed, with error message, timestamp, and channel type. Diagnose missed alerts from the dashboard without guessing.
Per-member opt-out
Each team member can disable specific event types for themselves without affecting other members. A developer can silence FinOps reports without muting critical alert fires.
Test any channel before going live
One-click test delivery from the channel settings page. Channel is marked verified on success. If delivery fails, the error is shown inline — no need to wait for a real alert to find out.
Alert the right person.
At the right time. Every time.
Set up your metrics, alert rules, and notification channels in minutes. Let the AI handle the rest.
No credit card required · Cancel any time