Your cloud bill.
Every provider.
One dashboard.
Multi-provider cost intelligence with AI waste detection, spend forecasting, anomaly alerts, commitment tracking, and chargeback — all connected to the AI Pilot for governed one-click savings.
Not just dashboards.
Decisions you can execute.
Most cost tools stop at charts. CloudAIPilot's FinOps module connects your spend data directly to the AI Pilot — so when a recommendation says "right-size this server," you can act on it in two clicks with a full approval trail.
4 providers, one normalized view
AWS, GCP, Azure, and DigitalOcean costs pulled from their native billing APIs, normalized to a single currency and timeline. Filter by cloud account, toggle windows from 7 to 90 days, and see spend as if it all came from one bill.
AI waste detection & recommendations
The cost agent runs daily and surfaces actionable waste: idle servers, orphaned volumes, unattached IPs, snapshots nobody uses, under-committed reserved instances, and more. Each finding includes a rationale and an estimated monthly saving.
Allocations, showback & chargeback
Create custom dimensions — by team, environment, project, or any tag — and break your cloud spend into labelled buckets. Export HMAC-signed CSV reports that finance teams can verify were never tampered with.
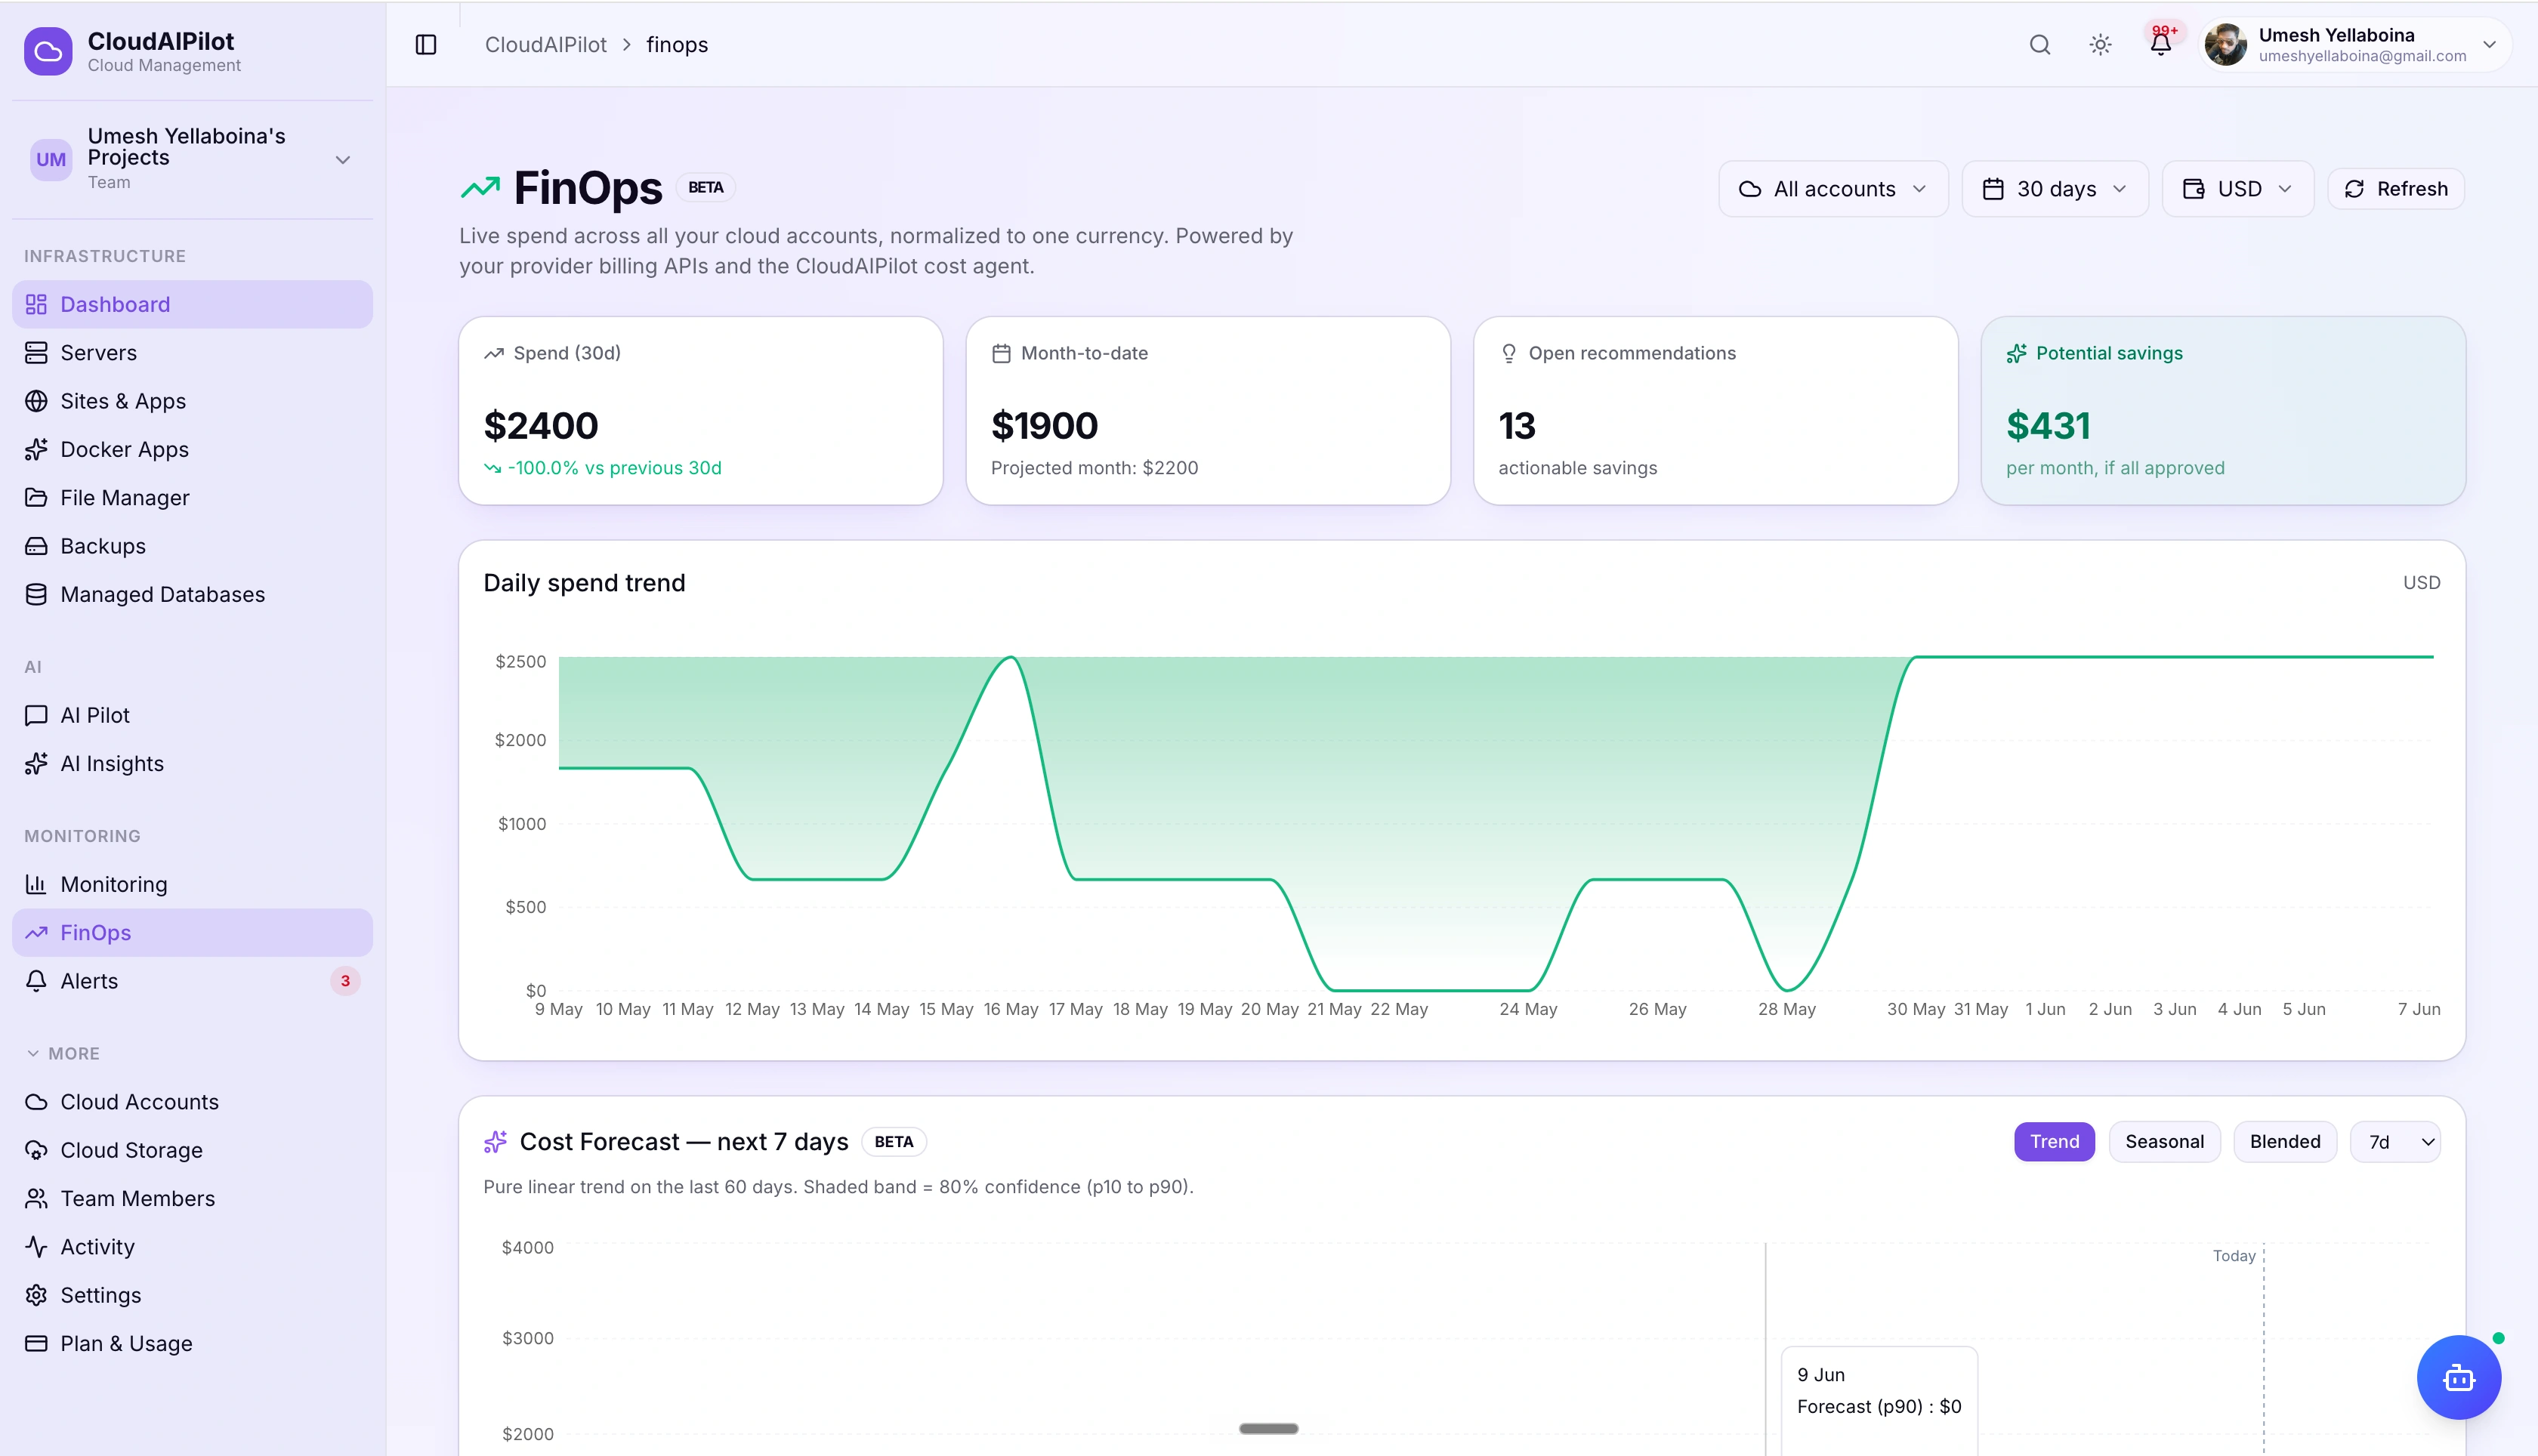
Four KPIs. One chart.
Complete spend picture.
The FinOps dashboard opens with four KPI tiles that answer the questions that matter most — how much did we spend, where are we this month, how much could we save, and are we trending up or down.
Daily spend trend with delta comparison
Area chart showing daily cost over your chosen window (7, 30, or 90 days), with a percentage delta vs. the previous period. Hover any day for the exact amount. Select any connected cloud account to isolate its trend.
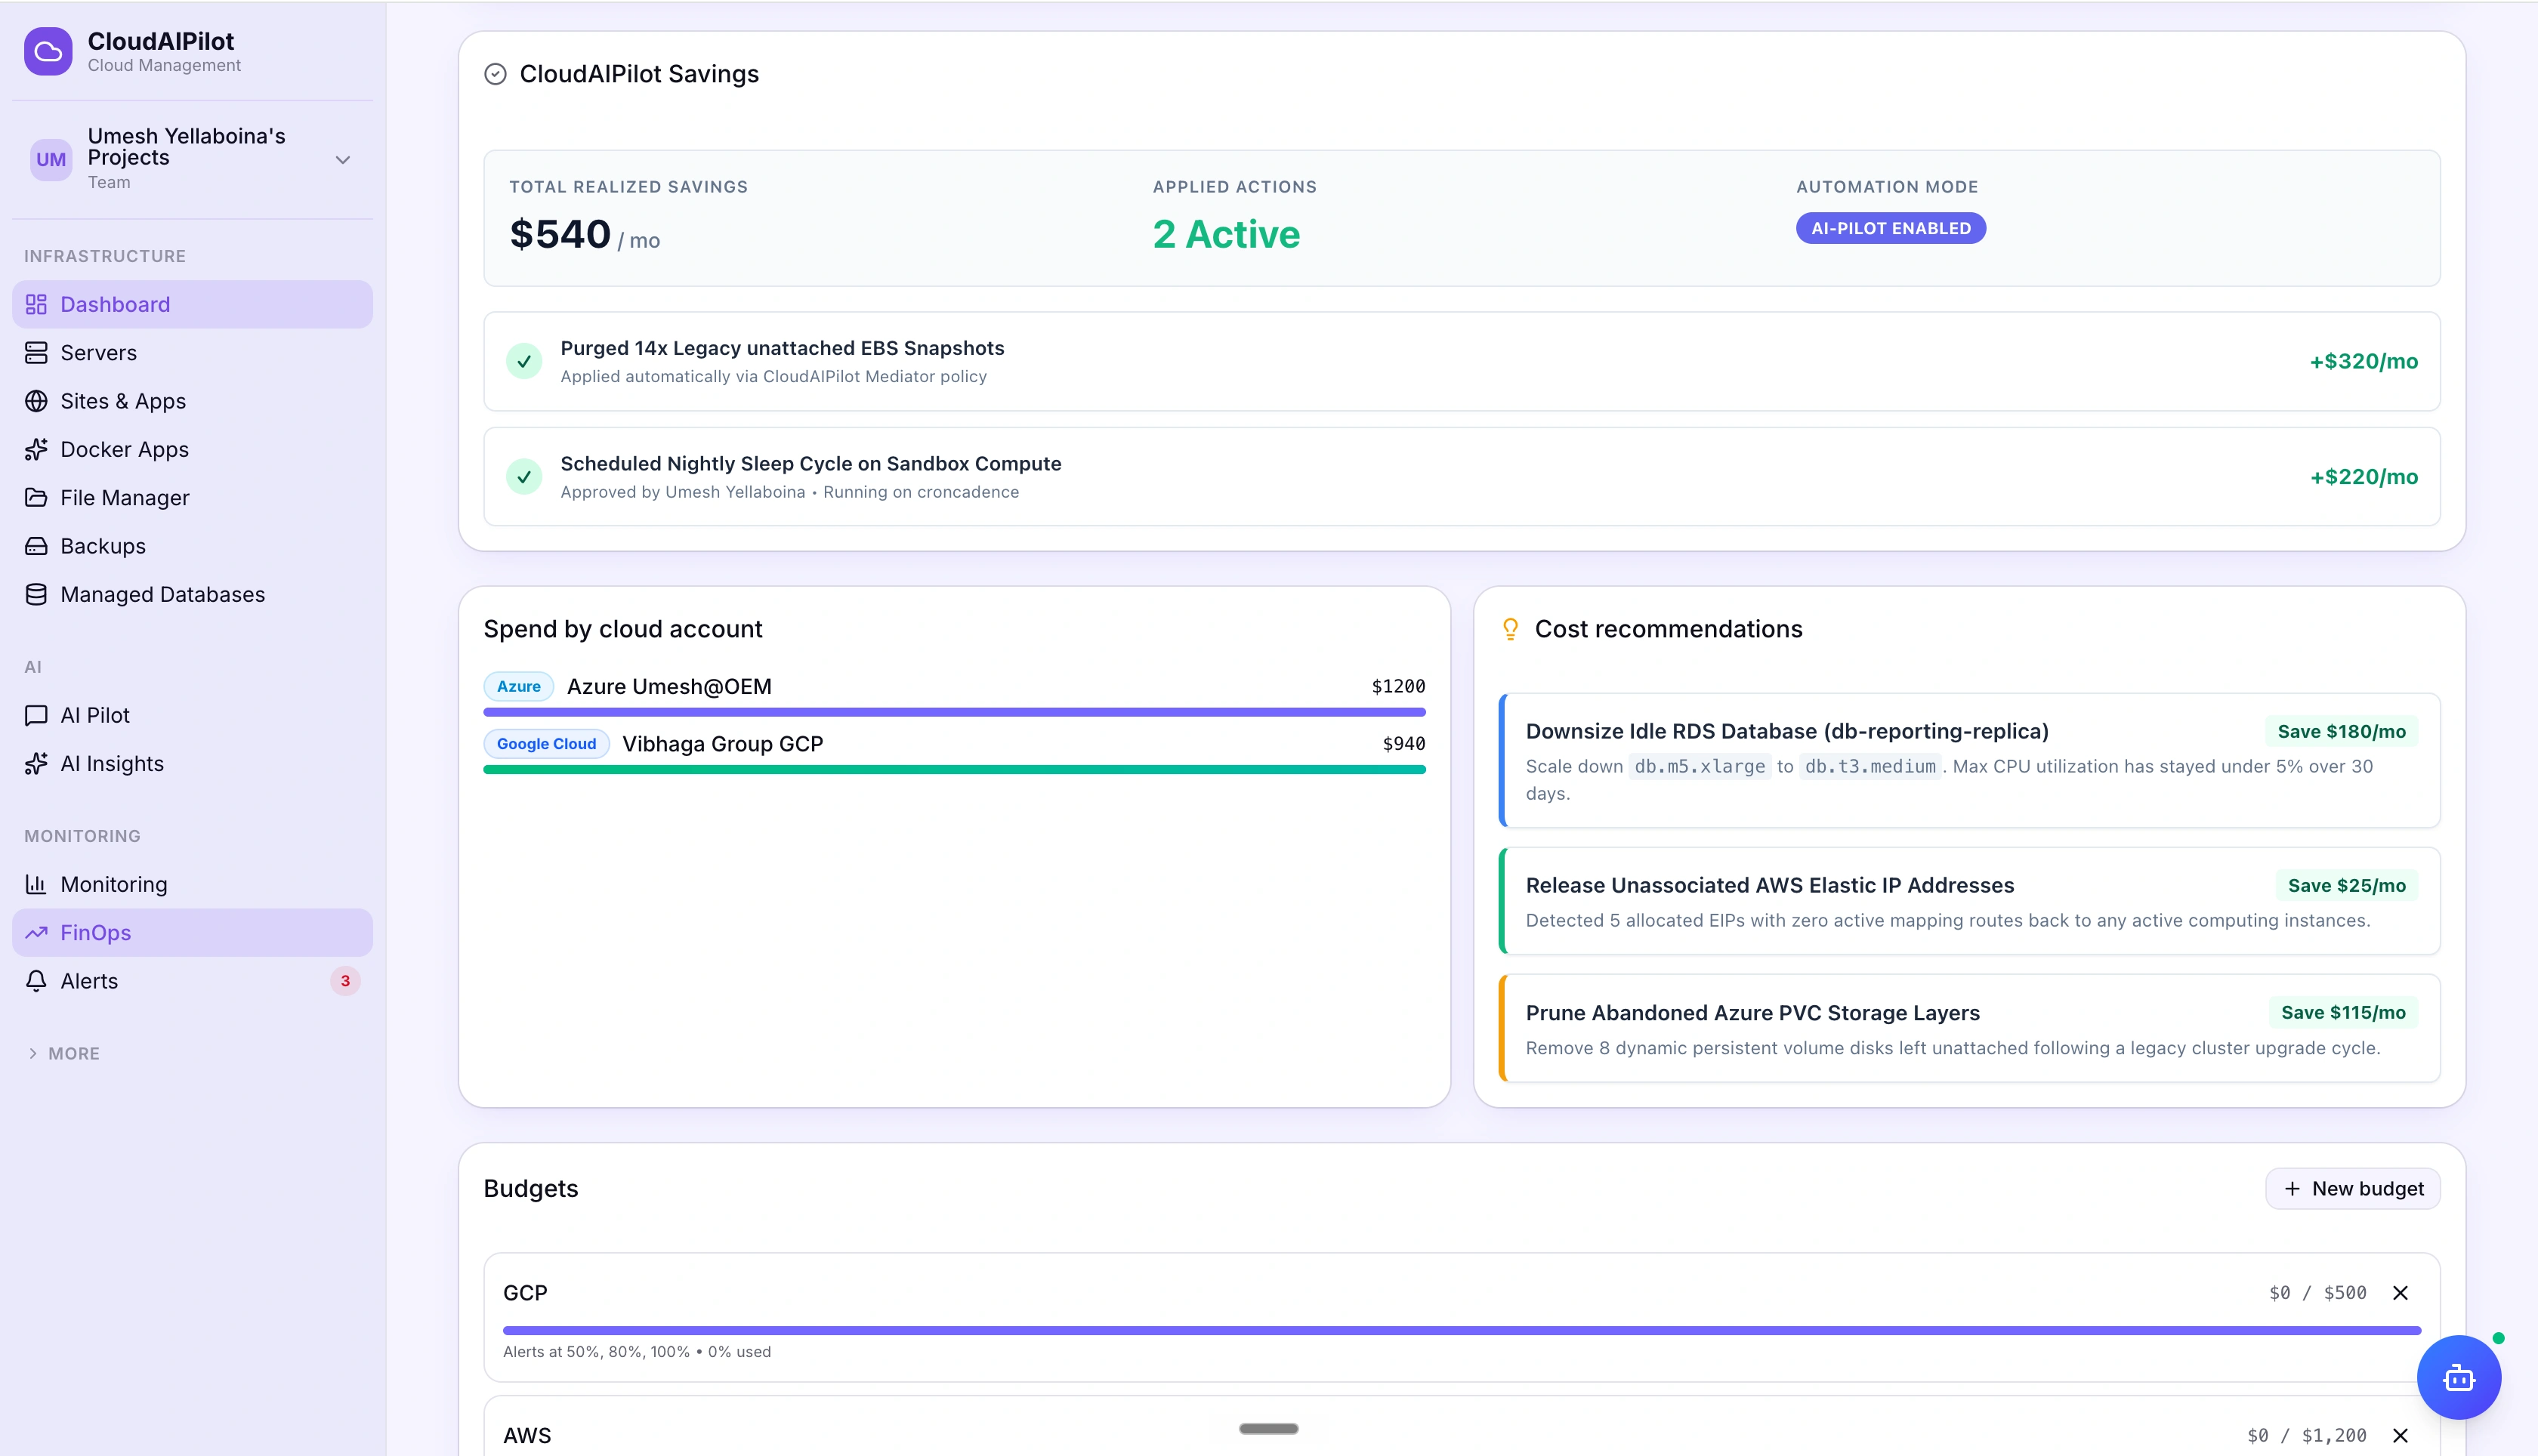
Spend by cloud account with bar breakdown
Proportional bar chart showing every connected account side by side — AWS, GCP, Azure, DigitalOcean — so you instantly see which provider is driving the most spend in the selected window.
The cost agent finds waste
you didn't know existed.
After each daily cost pull, the cost agent scans your infrastructure and surfaces findings with a plain-English rationale and an estimated monthly saving. When you're ready to act, one click opens the AI Pilot with the recommendation pre-loaded.
CloudAIPilot Savings widget tracks your wins
Every recommendation you approve and execute is added to a running savings total. The Savings widget shows cumulative monthly savings from all approved actions — so your team can see the real-world impact over time.
Recommendations route through AI Pilot
Accepting a recommendation doesn't execute it directly. It opens the AI Pilot with the action pre-loaded — giving you a governed approval flow with a snapshot, a rollback option, and a signed audit entry for every change.
Know what's coming
before the bill does.
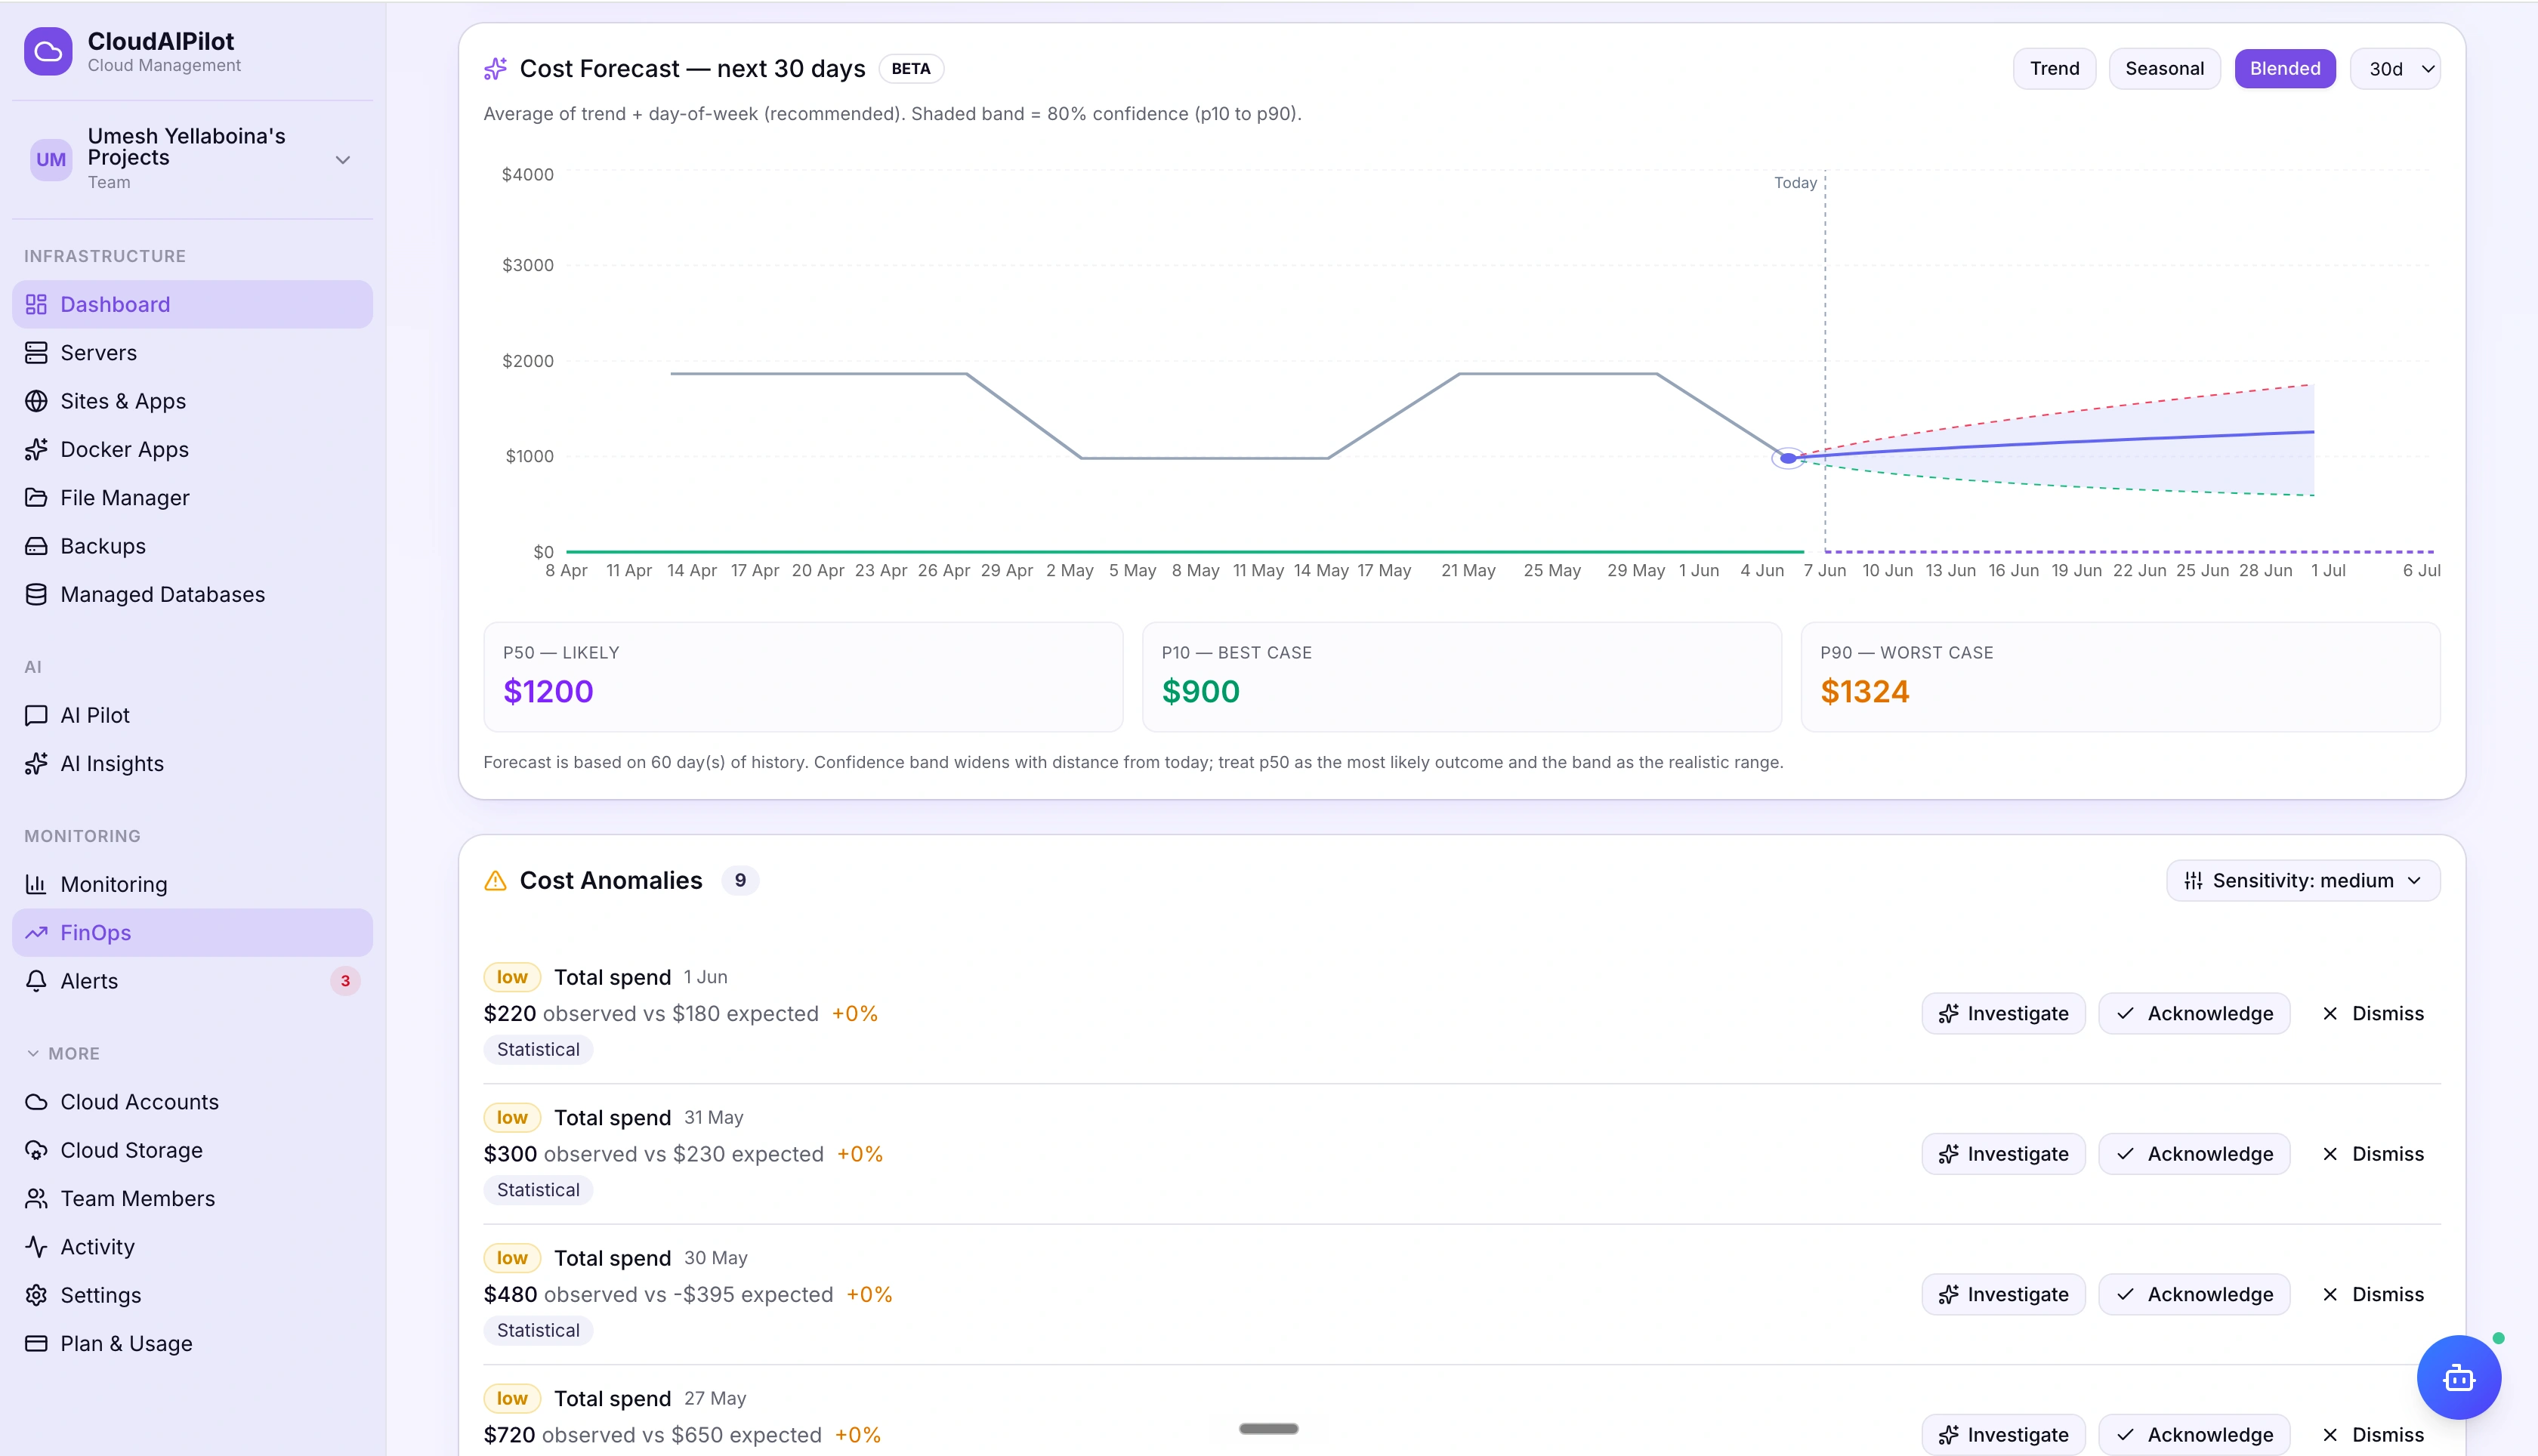
The forecast card projects your spend forward based on observed trends. The anomaly inbox flags cost spikes the moment they appear — so you're not discovering a $3,000 surprise at the end of the month.
ML-based spend forecast per account
Forecast card projects your end-of-month spend using observed daily trends, filtered to the selected cloud account. Compare forecast vs. current month-to-date to catch runaway spend early.
Anomaly inbox with % spike vs. 7-day average
Each anomaly shows the provider, account, and percentage deviation from the 7-day rolling average. No thresholds to configure — the detection runs automatically after every daily cost pull.
Reserved Instances.
Savings Plans. CUDs.
All tracked.
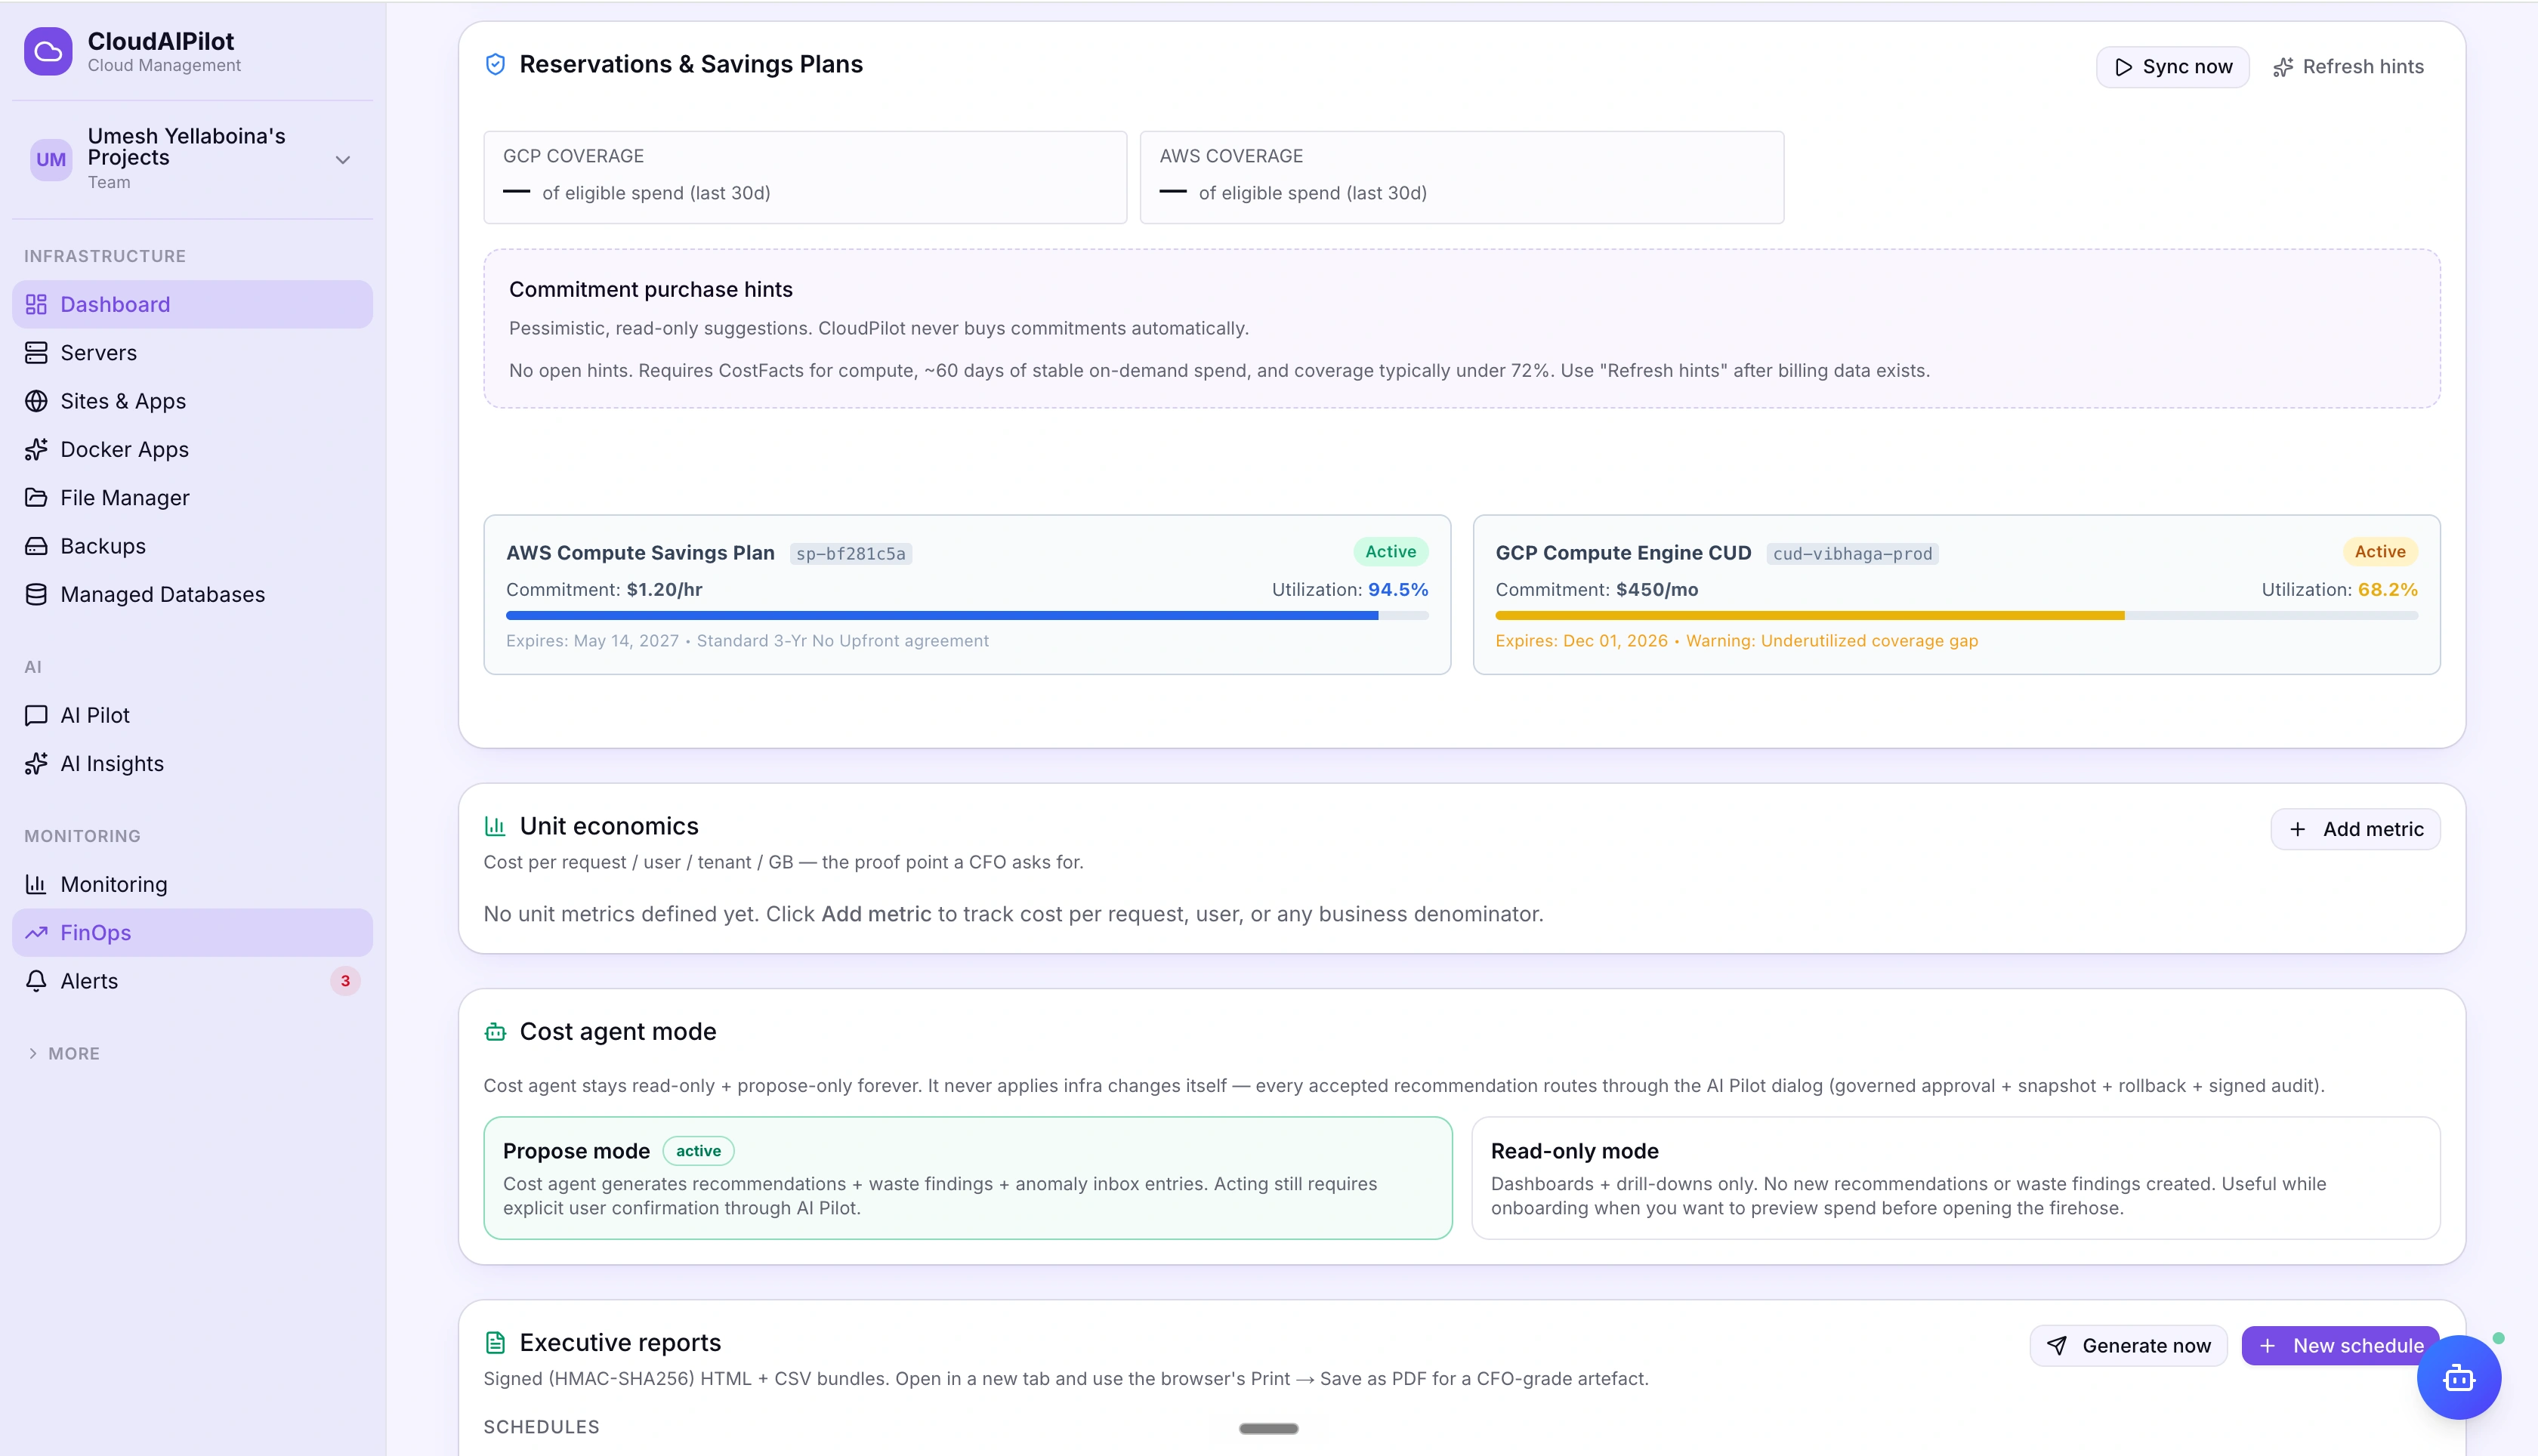
Commitments are where the biggest cloud savings hide — and also where teams most often leave money on the table. The Commitments card tracks your utilisation and coverage across all three major providers so you always know if you're getting the discount you paid for.
Set a limit. Get an alert.
No surprises.
Create monthly budgets in USD for any cloud account or your entire org. Alerts fire at 50%, 80%, and 100% so you have time to react before going over — not after you've already spent it.
Colour-coded progress bars per budget
Green below 50%, amber at 80%, red at 100% and over. Each budget row shows the exact USD spent vs. limit and the percentage consumed, updated each time cost data refreshes.
Threshold alerts via your notification channels
Budget alerts route through the same notification system as your monitoring alerts — Slack, email, Discord, PagerDuty, and more. No separate tool required.
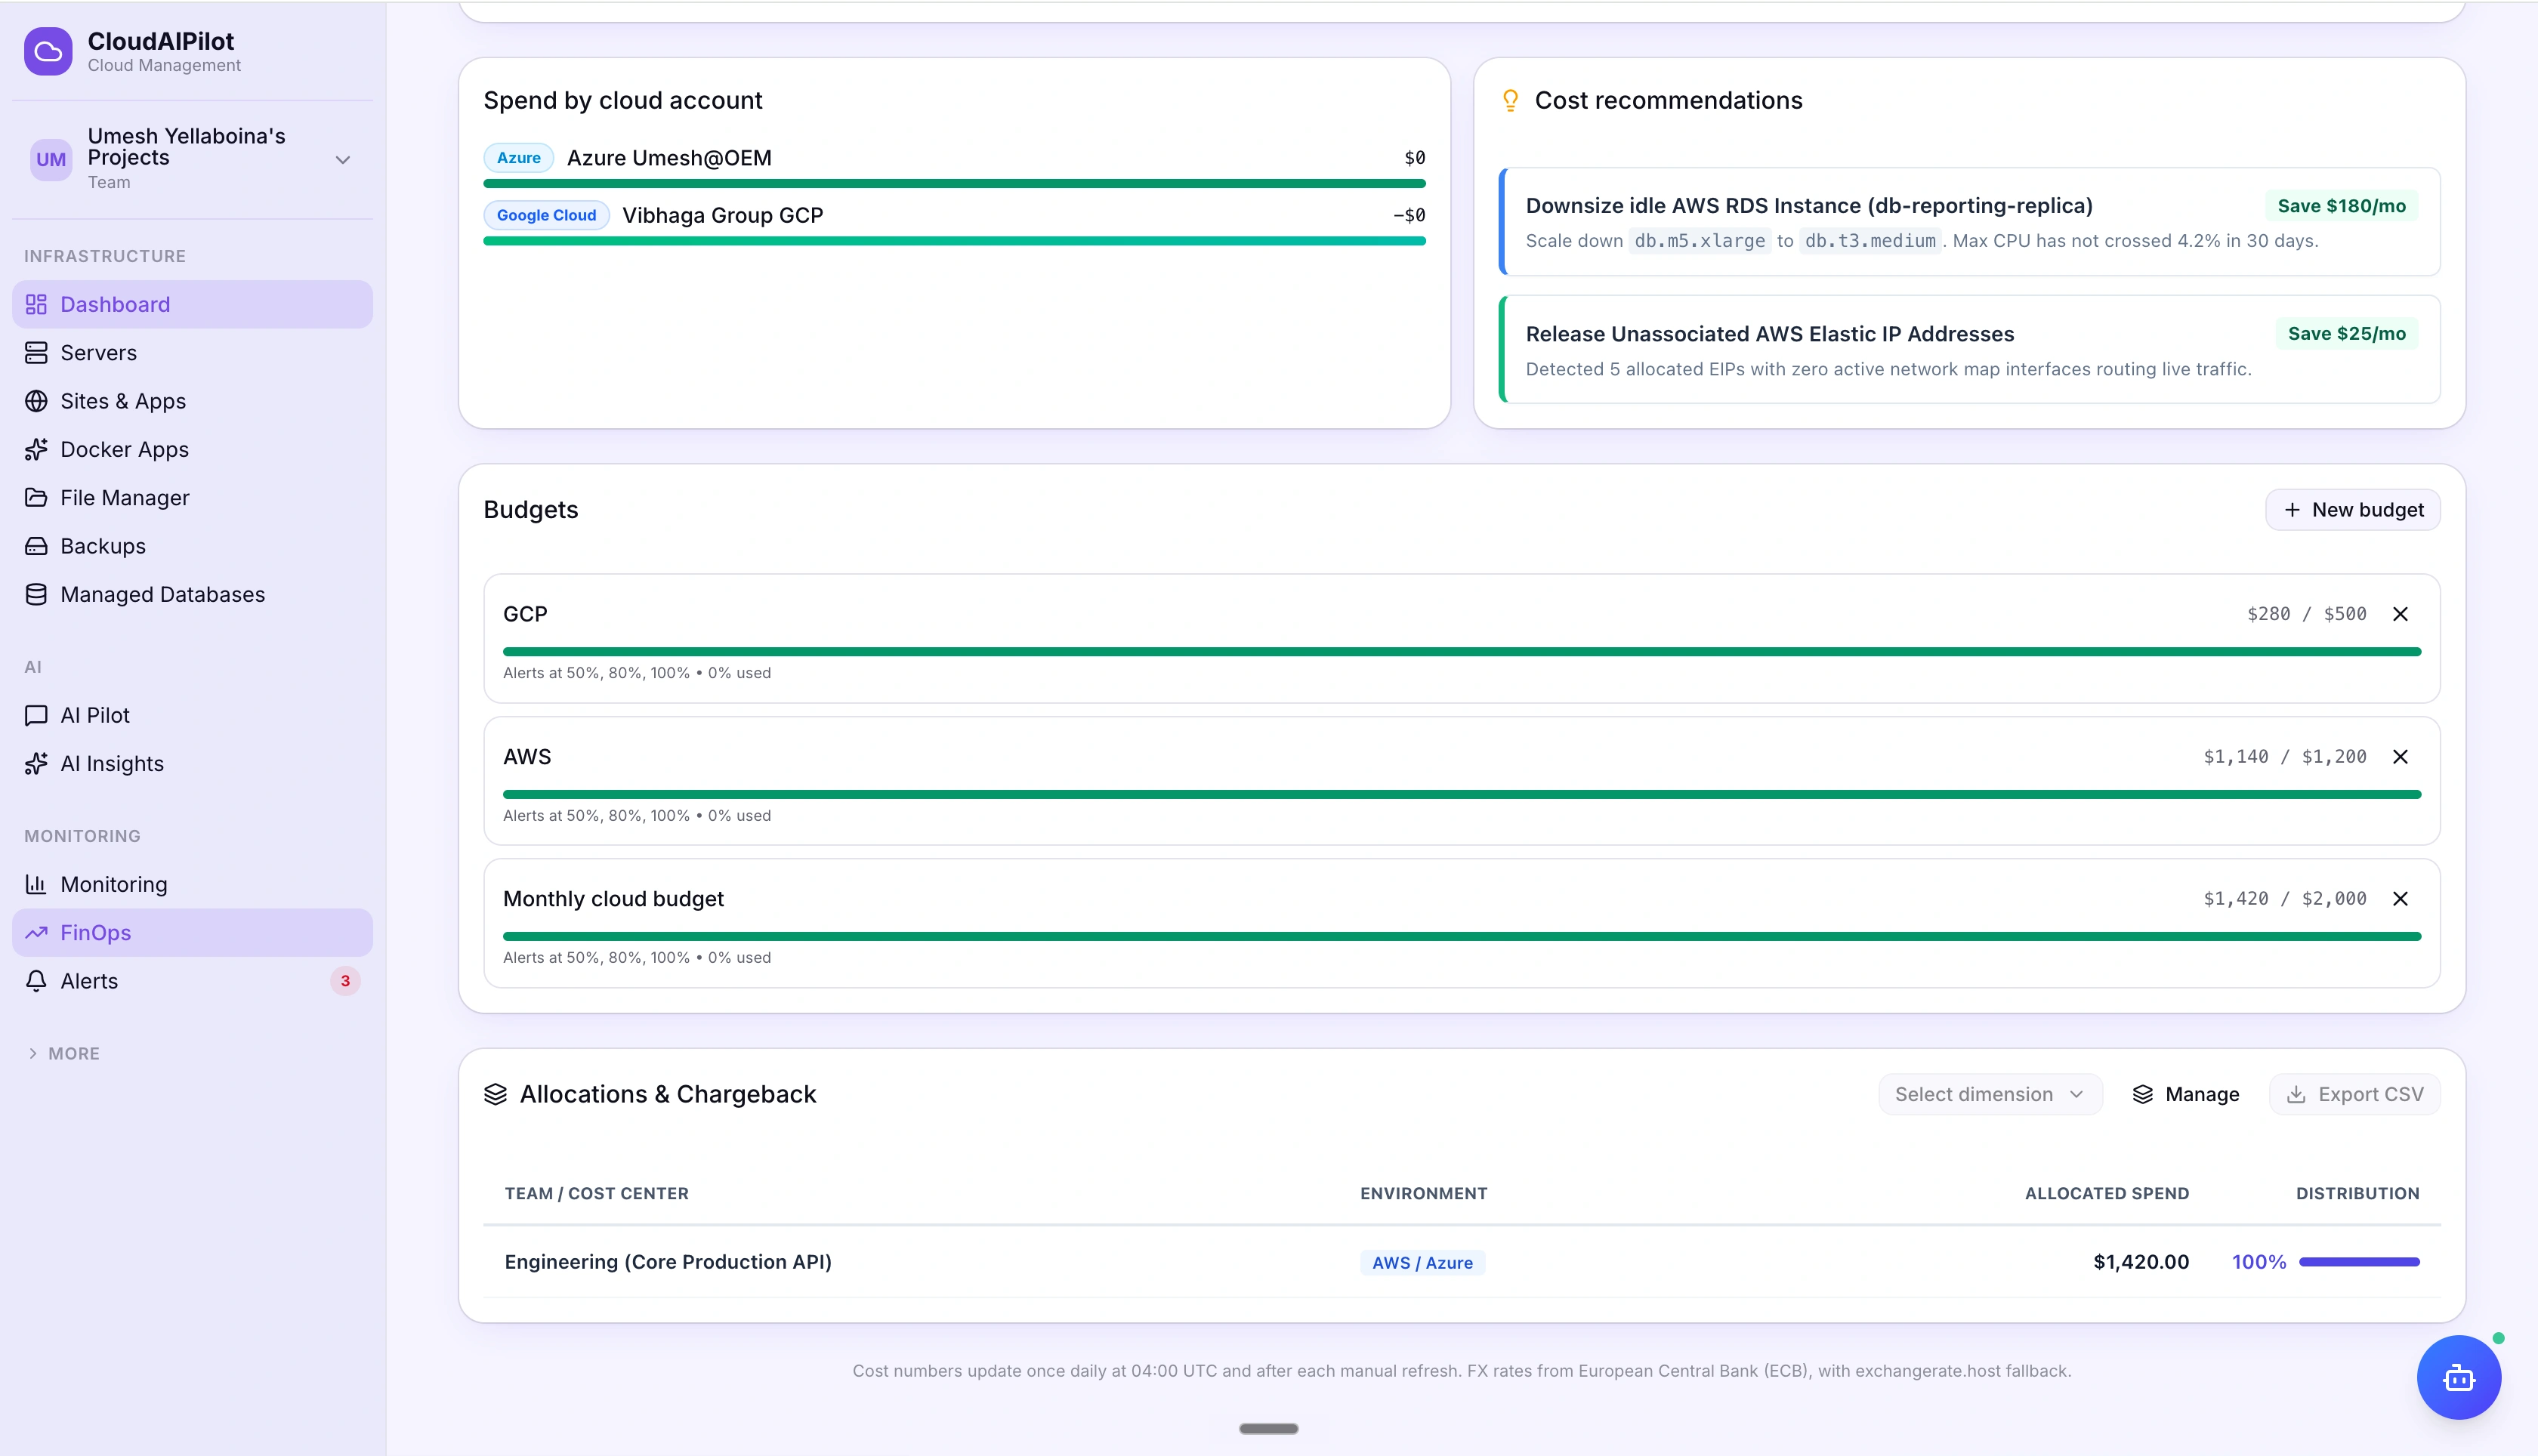
Break cost down
by team, project, or tag.
Create custom dimensions — any grouping you care about — and the platform allocates your cloud spend across them. For teams that need to show finance exactly who spent what, chargeback CSV exports include an HMAC signature so the file can be independently verified.
Unlimited custom dimensions
Define dimensions by any label you want — team, environment, cost centre, product, customer. Manage them in the Dimensions Manager dialog and switch between them instantly in the allocation view.
HMAC-signed CSV — tamper-proof for finance
Every chargeback CSV export includes an HMAC trailer generated server-side. Your finance team can run the verification check to confirm the numbers weren't modified after the export was created.
Cost agent mode — read-only or propose. Never execute.
The cost agent is a background process, not an autonomous actor. It analyses your spend, surfaces findings, and queues recommendations. It never applies infrastructure changes on its own. Every accepted recommendation routes through the AI Pilot's governed approval flow — with a snapshot, rollback option, and signed audit entry.
Connected to every provider.
Normalized to any currency.
Cost data is pulled from native billing APIs — AWS Cost Explorer, GCP BigQuery Billing Export, Azure Cost Management, and DigitalOcean — then normalized to your chosen display currency using daily ECB exchange rates.
FX rates from the European Central Bank (ECB) · Updated daily · exchangerate.host fallback
Stop guessing.
Start saving.
Connect your cloud accounts and let the cost agent surface your first savings opportunities — usually within 24 hours of the first cost pull.
No credit card required · Cancel any time